2nd Grade Data and Graphing Activities
About 2nd Grade Data And Graphing Activities
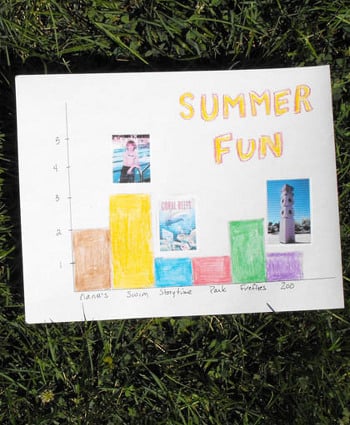
On Education.com, second-grade data and graphing activities involve hands-on methods for collecting and visually representing information. Students practice sorting, counting, and analyzing data through ways like pictographs, bar graphs, tally charts, and line plots, often inspired by real-world topics such as colors, favorite animals, or seasonal activities. These activities help build foundational skills in data collection and interpretation while making learning engaging and relevant.
Educational resources and worksheets on Education.com provide a range of graphing tools, interactive exercises, and lesson plans structured to support young learners. Teachers and parents can find printable charts, digital activities, and structured projects that guide children through organizing and representing data visually. These materials are designed to enhance understanding of graph concepts, data patterns, and critical thinking skills.
Using these activities at home or in the classroom saves time by providing ready-to-use, structured lessons that help children practice data organization and interpretation. By providing clear instructions and appropriate visual templates, educators and parents enable children to develop confidence in graphing and analysis while exploring everyday topics. These resources support both independent learning and guided instruction.


