SKIP TO CONTENT
Worksheet Generator
Subjects
Grades
Worksheets
Games
Build a Worksheet
More Resources
Roly Recommends
Math Month
Subjects
Grades
Worksheets
Games
Build a Worksheet
More Resources
Roly Recommends
Math Month
Filters
Search for: interpreting, data, using, graphs
✕
3rd - 7th Grade
✕
Subjects
Math
English Language Arts
Science
Social Studies
Foreign Language
Grade Level
Pre-K
K
1st
2nd
3rd
4th
5th
6th
7th
8th
Early Childhood
Elementary School
Middle School
Resource Type
Worksheets
Games
Lesson Plans
Interactive Worksheets
Workbooks
Activities
Exercises
Offline Games
Guided Lessons
Teacher Resources
See more
Occasion
Birthdays
Women's History Month
St. Patrick's Day
Ramadan
Passover
Spring
Easter
Earth Day
Cinco de Mayo
Mother's Day
Memorial Day
Summer
Father's Day
Independence Day
Back to School
Labor Day
Fall
Hispanic Heritage Month
Halloween
Veterans Day
Winter
Holidays
Thanksgiving
Christmas
Hanukkah
Kwanzaa
New Year
Martin Luther King Jr. Day
Lunar New Year
Valentine's Day
Presidents' Day
Black History Month
See more
Common Core
Yes
No
Roly Recommends
Social Emotional Learning
Game Type
Mazes
Ball Games
Crossword
Fitness & Exercise
Group Games
Outdoor Games
Printable Board Games
Puzzles & Sudoku
Travel Games
Word Puzzles
Word Search
See more
Arts & Crafts
Arts & Crafts
Fabric Projects
Beads & Jewelry
Paper & Glue Crafts
Construction & Sculpture
Painting & Drawing
Recycled Crafts
Coloring
Yes
Recipes
Snacks
Mains
Sides
English Language Support
Yes
See More
Clear All
View 4,123 results
Showing Results for interpreting data using graphs : Page 2
4,123 results
Search for: interpreting, data, using, graphs
✕
3rd - 7th Grade
✕
Clear All
Sort by:
Relevance
Most recent
Most popular
Alphabetical A-Z
Alphabetical Z-A
All filters
4,123 results
Sort by:
Relevance
Most recent
Most popular
Alphabetical A-Z
Alphabetical Z-A
Reading Pictographs: Building a New Town
Worksheet
Reading Pictographs: Building a New Town
Third Grade
Data and Graphing
In this 3rd grade math worksheet, kids practice interpreting graph data and using information in a pictograph to answer word problems.
Worksheet
Reading Pictographs: Building a New Town
Worksheet
Reading Pictographs: Building a New Town
In this 3rd grade math worksheet, kids practice interpreting graph data and using information in a pictograph to answer word problems.
Third Grade
Data and Graphing
Worksheet
Asking and Answering Questions about Line Plots and Bar Graphs
Lesson Plan
Asking and Answering Questions about Line Plots and Bar Graphs
Third Grade
Take students’ understanding of bar graphs and line plots to the next level. This lesson will encourage students to think about how graphs are designed and the questions we can ask and answer about data presented in graphs.
Lesson Plan
Asking and Answering Questions about Line Plots and Bar Graphs
Lesson Plan
Asking and Answering Questions about Line Plots and Bar Graphs
Take students’ understanding of bar graphs and line plots to the next level. This lesson will encourage students to think about how graphs are designed and the questions we can ask and answer about data presented in graphs.
Third Grade
Lesson Plan
Collecting and Organizing Data 2
Exercise
Collecting and Organizing Data 2
Fourth Grade
Data and Graphing
Your students will grow adept at collecting and organizing data around them with this engaging exercise.
Exercise
Collecting and Organizing Data 2
Exercise
Collecting and Organizing Data 2
Your students will grow adept at collecting and organizing data around them with this engaging exercise.
Fourth Grade
Data and Graphing
Exercise
Collecting and Organizing Data 1
Exercise
Collecting and Organizing Data 1
Third Grade
Data and Graphing
Students will learn how to collect and organize data thanks to this interesting exercise from Education.com.
Exercise
Collecting and Organizing Data 1
Exercise
Collecting and Organizing Data 1
Students will learn how to collect and organize data thanks to this interesting exercise from Education.com.
Third Grade
Data and Graphing
Exercise
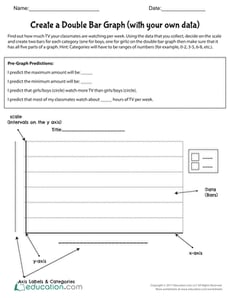
Create a Double Bar Graph (with your own data)
Worksheet
Create a Double Bar Graph (with your own data)
Fifth Grade
Data and Graphing
Students will collect data, create a double bar graph, and interpret the graph by responding to prompts that will get them thinking critically.
Worksheet
Create a Double Bar Graph (with your own data)
Worksheet
Create a Double Bar Graph (with your own data)
Students will collect data, create a double bar graph, and interpret the graph by responding to prompts that will get them thinking critically.
Fifth Grade
Data and Graphing
Worksheet
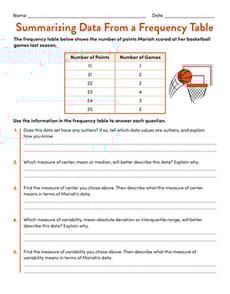
Summarizing Data From a Frequency Table
Worksheet
Summarizing Data From a Frequency Table
Sixth Grade
Data and Graphing
Practice summarizing a numerical data set with this one-page statistics worksheet!
Worksheet
Summarizing Data From a Frequency Table
Worksheet
Summarizing Data From a Frequency Table
Practice summarizing a numerical data set with this one-page statistics worksheet!
Sixth Grade
Data and Graphing
Worksheet
What is it Telling Me? Creating and Interpreting Line Plots
Lesson Plan
What is it Telling Me? Creating and Interpreting Line Plots
Third Grade
Data and Graphing
Line plots are a great way to introduce your students to graphing data. In this lesson, your students will learn how to create a line plot and also practice interpreting line plots.
Lesson Plan
What is it Telling Me? Creating and Interpreting Line Plots
Lesson Plan
What is it Telling Me? Creating and Interpreting Line Plots
Line plots are a great way to introduce your students to graphing data. In this lesson, your students will learn how to create a line plot and also practice interpreting line plots.
Third Grade
Data and Graphing
Lesson Plan
Data 1
Guided Lesson
Data 1
Third Grade
Fractions
Learning how to represent numerical information is a key part of the third grade math curriculum. This lesson in data provides guided instruction designed by our team of curriculum experts and teachers to present this concept in an engaging way. Not only that, but helpful exercises help kids to see the practical applicaton of these skills in the real world.
Guided Lesson
Data 1
Guided Lesson
Data 1
Learning how to represent numerical information is a key part of the third grade math curriculum. This lesson in data provides guided instruction designed by our team of curriculum experts and teachers to present this concept in an engaging way. Not only that, but helpful exercises help kids to see the practical applicaton of these skills in the real world.
Third Grade
Fractions
Guided Lesson
Collect, Organize, and Discuss the Data
Lesson Plan
Collect, Organize, and Discuss the Data
Third Grade
Support your students as they collect, organize, and discuss measurement data! Use this lesson independently or alongside
Making Measurements for Line Plots
.
Lesson Plan
Collect, Organize, and Discuss the Data
Lesson Plan
Collect, Organize, and Discuss the Data
Support your students as they collect, organize, and discuss measurement data! Use this lesson independently or alongside
Making Measurements for Line Plots
.
Third Grade
Lesson Plan
Go Runners! Practice Reading a Bar Graph
Worksheet
Go Runners! Practice Reading a Bar Graph
Third Grade
Data and Graphing
Your child will practice reading and interpreting a bar graph and using its data to answer a set of questions in this 3rd grade math worksheet.
Worksheet
Go Runners! Practice Reading a Bar Graph
Worksheet
Go Runners! Practice Reading a Bar Graph
Your child will practice reading and interpreting a bar graph and using its data to answer a set of questions in this 3rd grade math worksheet.
Third Grade
Data and Graphing
Worksheet
Collecting and Organizing Data 3
Exercise
Collecting and Organizing Data 3
Fifth Grade
Data and Graphing
By the time students complete this third exercise in the series, they will have become masters of collecting and organizing data.
Exercise
Collecting and Organizing Data 3
Exercise
Collecting and Organizing Data 3
By the time students complete this third exercise in the series, they will have become masters of collecting and organizing data.
Fifth Grade
Data and Graphing
Exercise
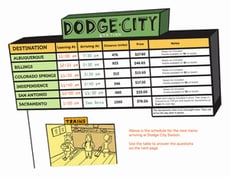
Data Chart: The Dodge City Train Station
Worksheet
Data Chart: The Dodge City Train Station
Fourth Grade
Measurement
Give your fourth-grader some real-world chart-reading practice with a familiar data chart: a train schedule!
Worksheet
Data Chart: The Dodge City Train Station
Worksheet
Data Chart: The Dodge City Train Station
Give your fourth-grader some real-world chart-reading practice with a familiar data chart: a train schedule!
Fourth Grade
Measurement
Worksheet
What Animals are Most Popular? A Data Analysis Project
Activity
What Animals are Most Popular? A Data Analysis Project
Second Grade
Engineering and Science Inquiry
What animals are most popular? This project affords practice in data-collection, record-keeping and data-analysis through the investigation of this question.
Activity
What Animals are Most Popular? A Data Analysis Project
Activity
What Animals are Most Popular? A Data Analysis Project
What animals are most popular? This project affords practice in data-collection, record-keeping and data-analysis through the investigation of this question.
Second Grade
Engineering and Science Inquiry
Activity
Glossary: Collect, Organize, and Discuss the Data
Worksheet
Glossary: Collect, Organize, and Discuss the Data
Third Grade
Fractions
Use this glossary with the EL Support Lesson: Collect, Organize, and Discuss the Data.
Worksheet
Glossary: Collect, Organize, and Discuss the Data
Worksheet
Glossary: Collect, Organize, and Discuss the Data
Use this glossary with the EL Support Lesson: Collect, Organize, and Discuss the Data.
Third Grade
Fractions
Worksheet
Drawing Inferences Using Data
Worksheet
Drawing Inferences Using Data
Seventh Grade
Data and Graphing
Students compare different survey methods to make inferences about how much time students at a school spend playing video games in this seventh-grade math worksheet.
Worksheet
Drawing Inferences Using Data
Worksheet
Drawing Inferences Using Data
Students compare different survey methods to make inferences about how much time students at a school spend playing video games in this seventh-grade math worksheet.
Seventh Grade
Data and Graphing
Worksheet
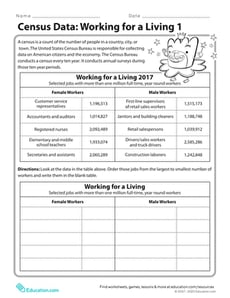
Census Data: Working for a Living 1
Worksheet
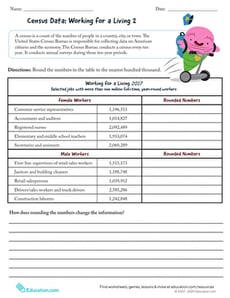
Census Data: Working for a Living 1
Fourth Grade
Math
Use the worksheet Census Data 2017: Working for a Living 1 to help learners order numbers from real-life data up to the millions place. Ask learners to compare and order the job and its total number of workers in the blank table from greatest to least.
Worksheet
Census Data: Working for a Living 1
Worksheet
Census Data: Working for a Living 1
Use the worksheet Census Data 2017: Working for a Living 1 to help learners order numbers from real-life data up to the millions place. Ask learners to compare and order the job and its total number of workers in the blank table from greatest to least.
Fourth Grade
Math
Worksheet
Vocabulary Cards: Collect, Organize, and Discuss the Data
Worksheet
Vocabulary Cards: Collect, Organize, and Discuss the Data
Third Grade
Fractions
Use these vocabulary cards with the EL Support Lesson: Collect, Organize, and Discuss the Data.
Worksheet
Vocabulary Cards: Collect, Organize, and Discuss the Data
Worksheet
Vocabulary Cards: Collect, Organize, and Discuss the Data
Use these vocabulary cards with the EL Support Lesson: Collect, Organize, and Discuss the Data.
Third Grade
Fractions
Worksheet
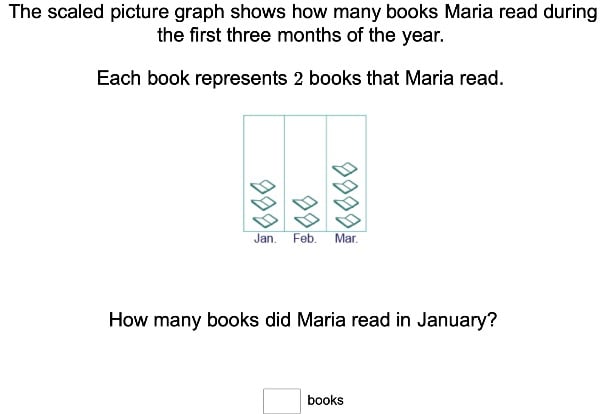
Scaled Picture Graphs
Exercise
Scaled Picture Graphs
Third Grade
Data and Graphing
For amateur mathematicians, this exercise will incorporate neat pictures into math time with scaled picture graphs.
Exercise
Scaled Picture Graphs
Exercise
Scaled Picture Graphs
For amateur mathematicians, this exercise will incorporate neat pictures into math time with scaled picture graphs.
Third Grade
Data and Graphing
Exercise
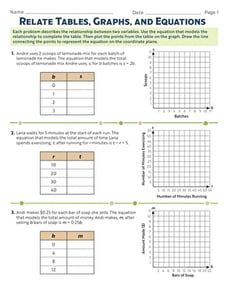
Relate Tables, Graphs, and Equations
Worksheet
Relate Tables, Graphs, and Equations
Sixth Grade
Algebra
Students analyze relationships between two variables using equations, tables, and graphs in this sixth-grade algebra worksheet!
Worksheet
Relate Tables, Graphs, and Equations
Worksheet
Relate Tables, Graphs, and Equations
Students analyze relationships between two variables using equations, tables, and graphs in this sixth-grade algebra worksheet!
Sixth Grade
Algebra
Worksheet
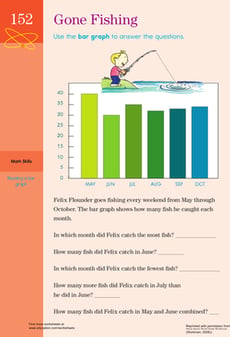
Getting Graphs: Gone Fishing!
Worksheet
Getting Graphs: Gone Fishing!
Third Grade
Data and Graphing
Hunting for a worksheet to help your kid with graphs? This printable helps your child to understand bar graphs.
Worksheet
Getting Graphs: Gone Fishing!
Worksheet
Getting Graphs: Gone Fishing!
Hunting for a worksheet to help your kid with graphs? This printable helps your child to understand bar graphs.
Third Grade
Data and Graphing
Worksheet
Create a Line Plot with Data Provided
Worksheet
Create a Line Plot with Data Provided
Third Grade
Data and Graphing
Use the data provided to have your students create a line plot that reflects how much TV watched per week for one third grade class.
Worksheet
Create a Line Plot with Data Provided
Worksheet
Create a Line Plot with Data Provided
Use the data provided to have your students create a line plot that reflects how much TV watched per week for one third grade class.
Third Grade
Data and Graphing
Worksheet
Census Data: Working for a Living 2
Worksheet
Census Data: Working for a Living 2
Fourth Grade
Place Value
Use the worksheet Census Data 2017: Working for a Living 2 to help learners round the total number of workers to the nearest hundred millions place.
Worksheet
Census Data: Working for a Living 2
Worksheet
Census Data: Working for a Living 2
Use the worksheet Census Data 2017: Working for a Living 2 to help learners round the total number of workers to the nearest hundred millions place.
Fourth Grade
Place Value
Worksheet
Bar Graphing with Eggs
Game
Bar Graphing with Eggs
Third Grade
Data and Graphing
It's raining eggs! Kids must move quickly to catch eggs for Farmer Brown, organizing and displaying the data using bar graphs in this silly game.
Game
Bar Graphing with Eggs
Game
Bar Graphing with Eggs
It's raining eggs! Kids must move quickly to catch eggs for Farmer Brown, organizing and displaying the data using bar graphs in this silly game.
Third Grade
Data and Graphing
Game
Word Problems: Interpreting Bar Graphs
Worksheet
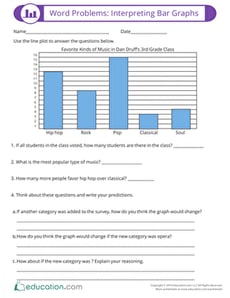
Word Problems: Interpreting Bar Graphs
Third Grade
Data and Graphing
Worksheet
Word Problems: Interpreting Bar Graphs
Worksheet
Word Problems: Interpreting Bar Graphs
Third Grade
Data and Graphing
Worksheet
Reading Graphs
Worksheet
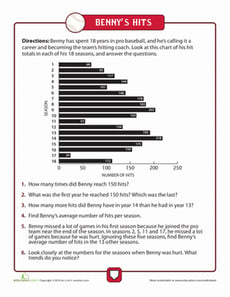
Reading Graphs
Third Grade
Data and Graphing
Try getting started with reading graphs with this worksheet showing a baseball player's hits throughout his career, and answer the word problems.
Worksheet
Reading Graphs
Worksheet
Reading Graphs
Try getting started with reading graphs with this worksheet showing a baseball player's hits throughout his career, and answer the word problems.
Third Grade
Data and Graphing
Worksheet
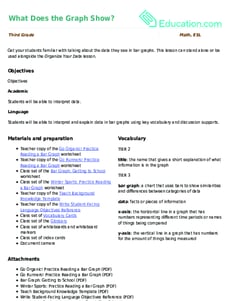
What Does the Graph Show?
Lesson Plan
What Does the Graph Show?
Third Grade
Get your students familiar with talking about the data they see in bar graphs. This lesson can stand alone or be used alongside the
Organize Your Data
lesson.
Lesson Plan
What Does the Graph Show?
Lesson Plan
What Does the Graph Show?
Get your students familiar with talking about the data they see in bar graphs. This lesson can stand alone or be used alongside the
Organize Your Data
lesson.
Third Grade
Lesson Plan
Reading Pictographs: Going to the Theater
Worksheet
Reading Pictographs: Going to the Theater
Third Grade
Data and Graphing
In this 3rd grade math worksheet, kids practice interpreting graph data as they use the information in a pictograph to answer a set of questions.
Worksheet
Reading Pictographs: Going to the Theater
Worksheet
Reading Pictographs: Going to the Theater
In this 3rd grade math worksheet, kids practice interpreting graph data as they use the information in a pictograph to answer a set of questions.
Third Grade
Data and Graphing
Worksheet
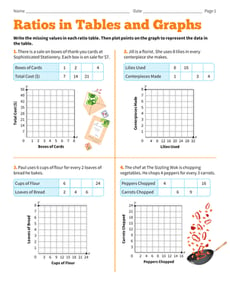
Ratios in Tables and Graphs
Worksheet
Ratios in Tables and Graphs
Sixth Grade
Ratios and Proportions
Practice filling in ratios in tables and graphs with this sixth-grade math worksheet!
Worksheet
Ratios in Tables and Graphs
Worksheet
Ratios in Tables and Graphs
Practice filling in ratios in tables and graphs with this sixth-grade math worksheet!
Sixth Grade
Ratios and Proportions
Worksheet
Word Problems: Interpreting Line Plots
Worksheet
Word Problems: Interpreting Line Plots
Second Grade
Data and Graphing
Students will have a chance to practice solving word problems using line plots with this worksheet.
Worksheet
Word Problems: Interpreting Line Plots
Worksheet
Word Problems: Interpreting Line Plots
Students will have a chance to practice solving word problems using line plots with this worksheet.
Second Grade
Data and Graphing
Worksheet
Using a Chart: Do Your Chores!
Worksheet
Using a Chart: Do Your Chores!
Third Grade
Data and Graphing
Kids completing this third grade math worksheet use a chart to compare data and solve addition problems.
Worksheet
Using a Chart: Do Your Chores!
Worksheet
Using a Chart: Do Your Chores!
Kids completing this third grade math worksheet use a chart to compare data and solve addition problems.
Third Grade
Data and Graphing
Worksheet
1
2
3
4
…
138