3rd Grade Picture Graphs Resources
About 3rd Grade Picture Graphs Resources
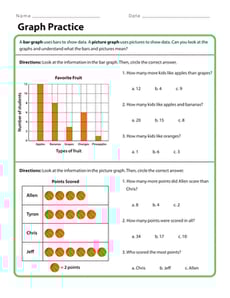
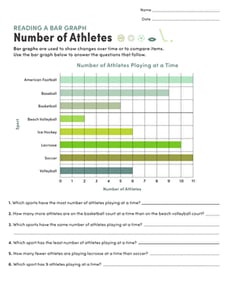
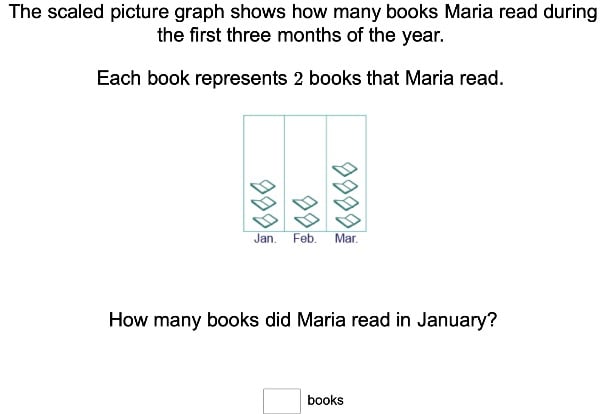
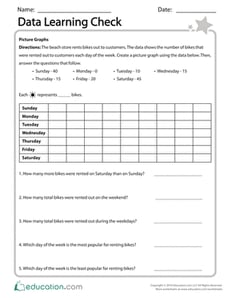
On Education.com, students can learn about drawing and interpreting picture graphs through a wide selection of worksheets, printable activities, and lesson plans. These resources help young learners recognize trends, compare data, and understand how visual representations make data easier to analyze. Materials are designed to strengthen foundational math skills while providing engaging visuals that capture students' interest.
This page offers 3rd grade picture graphs resources, including axis labels, data collection challenges, and practice exercises. These materials enable teachers and parents to introduce students to graphing concepts with step-by-step guidance and real-world examples. Structured activities help solidify understanding of data collection, accuracy in representation, and communicating findings visually.
Educators and parents can use these structured picture graph resources in classroom lessons, at-home practice, or assessments to reinforce graphing skills. The hands-on activities and worksheets provide consistent practice while enabling students to apply concepts to tables, charts, and everyday datasets. Using these educational resources encourages critical thinking, pattern recognition, and confident data presentation.
