5th Grade Line Plots Resources


About 5th Grade Line Plots Resources
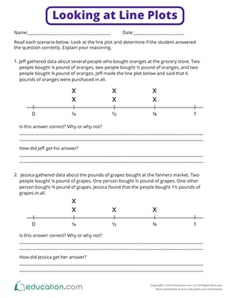
On Education.com, fifth grade line plots worksheets help students collect, organize, and interpret data by representing it visually. These resources guide learners in creating accurate graphs and analyzing trends, reinforcing foundational math skills. The site offers printable activities, lesson plans, and practice exercises tailored to grade 5 mathematics education.
Students can explore interactive digital simulations, teacher-led worksheets, and classroom activities that make understanding data and graphs engaging. Education.com provides a wide variety of resources that support curriculum standards and help students develop critical thinking and data analysis skills. These instructional materials are suitable for both reinforcing classroom learning and supporting homework assignments.
Educators and parents can access ready-to-use materials that streamline lesson planning and enable hands-on learning. With structured exercises, visual aids, and collaborative projects, students gain confidence in data collection and presentation. Browse Education.com for comprehensive, grade-specific line plot resources that make learning fun and practical.