SKIP TO CONTENT
Worksheet Generator
Subjects
Grades
Worksheets
Games
Build a Worksheet
More Resources
Roly Recommends
Subjects
Grades
Worksheets
Games
Build a Worksheet
More Resources
Roly Recommends
All Subjects
Math
Subtopics:
Addition
Subtraction
Multiplication
Numbers and Counting
Mixed Operations
Fractions
Time and Money
Geometry
Measurement
Data and Graphing
Show Less
Filters
Search for: graphing, data
✕
Math
✕
Kindergarten - 3rd Grade
✕
Common Core
✕
Subjects
Math
English Language Arts
Science
Social Studies
Grade Level
Pre-K
K
1st
2nd
3rd
4th
5th
6th
7th
8th
Early Childhood
Elementary School
Middle School
Resource Type
Worksheets
Games
Lesson Plans
Interactive Worksheets
Workbooks
Activities
Exercises
Songs
Teacher Resources
See more
Occasion
Easter
Summer
Back to School
Fall
Winter
Holidays
Valentine's Day
Common Core
Yes
English Language Support
Yes
See More
Clear All
View 156 results
Showing Results for graphing data : Page 6
156 results
Search for: graphing, data
✕
Math
✕
Kindergarten - 3rd Grade
✕
Common Core
✕
Clear All
Sort by:
Relevance
Most recent
Most popular
Alphabetical A-Z
Alphabetical Z-A
All filters
156 results
Sort by:
Relevance
Most recent
Most popular
Alphabetical A-Z
Alphabetical Z-A
Favorite Cities Bar Graph
Worksheet
Favorite Cities Bar Graph
Second Grade
Data and Graphing
Can your second grader make her own bar chart? Use this pretend survey of 38 people and their favorite cities to find out!
Worksheet
Favorite Cities Bar Graph
Worksheet
Favorite Cities Bar Graph
Can your second grader make her own bar chart? Use this pretend survey of 38 people and their favorite cities to find out!
Second Grade
Data and Graphing
Worksheet
Tally Chart: At the Sushi Counter
Worksheet
Tally Chart: At the Sushi Counter
First Grade
Data and Graphing
The chef made a lot of sushi today during lunch. Can your child help him figure out how much sushi he made by filling in the table with tally marks?
Worksheet
Tally Chart: At the Sushi Counter
Worksheet
Tally Chart: At the Sushi Counter
The chef made a lot of sushi today during lunch. Can your child help him figure out how much sushi he made by filling in the table with tally marks?
First Grade
Data and Graphing
Worksheet
Build a Bar Graph: Favorite Wild Animals
Worksheet
Build a Bar Graph: Favorite Wild Animals
Second Grade
Data and Graphing
Analyze a bar graph with this second-grade worksheet!
Worksheet
Build a Bar Graph: Favorite Wild Animals
Worksheet
Build a Bar Graph: Favorite Wild Animals
Analyze a bar graph with this second-grade worksheet!
Second Grade
Data and Graphing
Worksheet
More, Less, or Equal: Comparing Quantities
Lesson Plan
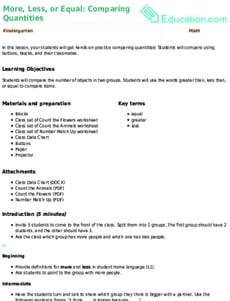
More, Less, or Equal: Comparing Quantities
Kindergarten
Numbers and Counting
In this lesson, your students will get hands-on practice comparing quantities! Students will compare using buttons, blocks, and their classmates.
Lesson Plan
More, Less, or Equal: Comparing Quantities
Lesson Plan
More, Less, or Equal: Comparing Quantities
In this lesson, your students will get hands-on practice comparing quantities! Students will compare using buttons, blocks, and their classmates.
Kindergarten
Numbers and Counting
Lesson Plan
Tour the World: Climates
Lesson Plan
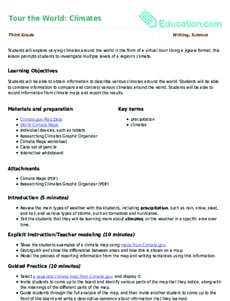
Tour the World: Climates
Third Grade
Measurement
Students will explore varying climates around the world in the form of a virtual tour! Using a jigsaw format, this lesson prompts students to investigate multiple levels of a region’s climate.
Lesson Plan
Tour the World: Climates
Lesson Plan
Tour the World: Climates
Students will explore varying climates around the world in the form of a virtual tour! Using a jigsaw format, this lesson prompts students to investigate multiple levels of a region’s climate.
Third Grade
Measurement
Lesson Plan
Mean, Median and Mode Madness!
Lesson Plan
Mean, Median and Mode Madness!
Third Grade
Data and Graphing
This lesson introduces students to the concepts of mean, median, and mode in a hands-on and visual way.
Lesson Plan
Mean, Median and Mode Madness!
Lesson Plan
Mean, Median and Mode Madness!
This lesson introduces students to the concepts of mean, median, and mode in a hands-on and visual way.
Third Grade
Data and Graphing
Lesson Plan
1
2
3
4
5
6