6th Grade Common Core Histograms Resources
Common Core Quick Links:
Common Core Standards for 6th Grade Math, Common Core Standards for 6th Grade ELA6 results
Math
✕6th Grade
✕Common Core
✕6 results
6th Grade Common Core Histograms Resources
Common Core Quick Links:
Common Core Standards for 6th Grade Math, Common Core Standards for 6th Grade ELA6 results
Math
✕6th Grade
✕Common Core
✕6 results


About 6th Grade Common Core Histograms Resources
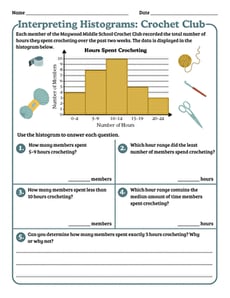
On Education.com, this page provides information on 6th grade activities that explore histograms, a key tool in visual data interpretation. Students learn to organize data into intervals, read graph heights, and interpret patterns, supporting math standards and critical thinking.
Educators can access a variety of printable worksheets, interactive graph simulations, and lesson plans designed to teach frequency distributions and data analysis to 6th grade students. These resources help strengthen foundational math skills while engaging young learners with hands-on practice.
Parents and teachers can use these materials to reinforce classroom lessons on histograms, prepare students for assessments, or introduce data visualization concepts in a fun and interactive way. Each activity makes complex data analysis accessible and encourages analytical thinking.