SKIP TO CONTENT
Worksheet Generator
Subjects
Grades
Worksheets
Games
Build a Worksheet
More Resources
Roly Recommends
Subjects
Grades
Worksheets
Games
Build a Worksheet
More Resources
Roly Recommends
All Subjects
Math
Data and Graphing
Subtopics:
Collecting and Organizing Data
Picture Graphs
Bar Graphs
Line Plots
Coordinate Plane
Box Plots
Histograms
Scatter Plots
Show Less
Filters
Search for: interpretting, data, using, graphs, recipes
✕
Math
✕
Common Core
✕
Subjects
Math
English Language Arts
Science
Social Studies
Grade Level
Pre-K
K
1st
2nd
3rd
4th
5th
6th
7th
8th
Early Childhood
Elementary School
Middle School
Resource Type
Worksheets
Games
Lesson Plans
Interactive Worksheets
Workbooks
Activities
Exercises
Teacher Resources
Occasion
Summer
Back to School
Halloween
Holidays
Valentine's Day
Common Core
Yes
English Language Support
Yes
See More
Clear All
View 192 results
Showing Results for interpretting data using graphs recipes : Page 4
192 results
Search for: interpretting, data, using, graphs, recipes
✕
Math
✕
Common Core
✕
Clear All
Sort by:
Relevance
Most recent
Most popular
Alphabetical A-Z
Alphabetical Z-A
All filters
192 results
Sort by:
Relevance
Most recent
Most popular
Alphabetical A-Z
Alphabetical Z-A
Bar Graphs: Favorite Drink
Worksheet
Bar Graphs: Favorite Drink
Second Grade
Data and Graphing
Which drink is most popular? Get your student ready for graphing with this fun bar graphing worksheet!
Worksheet
Bar Graphs: Favorite Drink
Worksheet
Bar Graphs: Favorite Drink
Which drink is most popular? Get your student ready for graphing with this fun bar graphing worksheet!
Second Grade
Data and Graphing
Worksheet
Reading Pictographs: Going to the Theater
Worksheet
Reading Pictographs: Going to the Theater
Third Grade
Data and Graphing
In this 3rd grade math worksheet, kids practice interpreting graph data as they use the information in a pictograph to answer a set of questions.
Worksheet
Reading Pictographs: Going to the Theater
Worksheet
Reading Pictographs: Going to the Theater
In this 3rd grade math worksheet, kids practice interpreting graph data as they use the information in a pictograph to answer a set of questions.
Third Grade
Data and Graphing
Worksheet
What is it Telling Me? Creating and Interpreting Line Plots
Lesson Plan
What is it Telling Me? Creating and Interpreting Line Plots
Third Grade
Data and Graphing
Line plots are a great way to introduce your students to graphing data. In this lesson, your students will learn how to create a line plot and also practice interpreting line plots.
Lesson Plan
What is it Telling Me? Creating and Interpreting Line Plots
Lesson Plan
What is it Telling Me? Creating and Interpreting Line Plots
Line plots are a great way to introduce your students to graphing data. In this lesson, your students will learn how to create a line plot and also practice interpreting line plots.
Third Grade
Data and Graphing
Lesson Plan
Foot Length: Create a Line Plot with Fractional Units
Worksheet
Foot Length: Create a Line Plot with Fractional Units
Fourth Grade
Data and Graphing
This worksheet challenges third graders to interpret the data and create a line plot with fractions, a key skill for fourth grade math.
Worksheet
Foot Length: Create a Line Plot with Fractional Units
Worksheet
Foot Length: Create a Line Plot with Fractional Units
This worksheet challenges third graders to interpret the data and create a line plot with fractions, a key skill for fourth grade math.
Fourth Grade
Data and Graphing
Worksheet
Line Plot Practice
Worksheet
Line Plot Practice
Second Grade
Data and Graphing
Use this worksheet to get your mathematicians comfortable and confident creating and interpreting line plots from a given set of data.
Worksheet
Line Plot Practice
Worksheet
Line Plot Practice
Use this worksheet to get your mathematicians comfortable and confident creating and interpreting line plots from a given set of data.
Second Grade
Data and Graphing
Worksheet
Weather Log
Worksheet
Weather Log
First Grade
Measurement
Rain or shine, get ready for some weather watching! Record data to observe the weather patterns over the course of a week.
Worksheet
Weather Log
Worksheet
Weather Log
Rain or shine, get ready for some weather watching! Record data to observe the weather patterns over the course of a week.
First Grade
Measurement
Worksheet
What Do We Know About Pets?
Worksheet
What Do We Know About Pets?
First Grade
Data and Graphing
Ms. Martin collected data about her class' favorite pets. Ask your students to use the bar graph with Ms. Martin's findings to answer the questions on the worksheet.
Worksheet
What Do We Know About Pets?
Worksheet
What Do We Know About Pets?
Ms. Martin collected data about her class' favorite pets. Ask your students to use the bar graph with Ms. Martin's findings to answer the questions on the worksheet.
First Grade
Data and Graphing
Worksheet
Ocean Lake River Questions
Worksheet
Ocean Lake River Questions
Second Grade
Data and Graphing
Do you prefer rivers, oceans, or lakes? Students will practice coming up with questions by analyzing the data given in this Venn diagram.
Worksheet
Ocean Lake River Questions
Worksheet
Ocean Lake River Questions
Do you prefer rivers, oceans, or lakes? Students will practice coming up with questions by analyzing the data given in this Venn diagram.
Second Grade
Data and Graphing
Worksheet
Eat Healthy Bar Graph
Worksheet
Eat Healthy Bar Graph
Third Grade
Data and Graphing
Use this relevant topic about healthy food to give your students practice reading a bar graph and answering questions about the data.
Worksheet
Eat Healthy Bar Graph
Worksheet
Eat Healthy Bar Graph
Use this relevant topic about healthy food to give your students practice reading a bar graph and answering questions about the data.
Third Grade
Data and Graphing
Worksheet
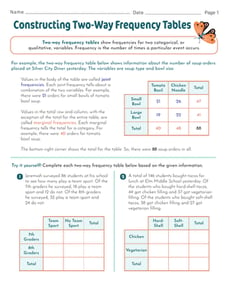
Constructing Two-Way Frequency Tables
Interactive Worksheet
Constructing Two-Way Frequency Tables
Eighth Grade
Data and Graphing
In this eighth-grade math worksheet, learners will then get to practice constructing two-way frequency tables given written descriptions of real-world data.
Interactive Worksheet
Constructing Two-Way Frequency Tables
Interactive Worksheet
Constructing Two-Way Frequency Tables
In this eighth-grade math worksheet, learners will then get to practice constructing two-way frequency tables given written descriptions of real-world data.
Eighth Grade
Data and Graphing
Interactive Worksheet
Pick a Flower Pictograph
Worksheet
Pick a Flower Pictograph
Second Grade
Data and Graphing
Find out exactly how many flowers Stefanie has planted with this pictograph for kids. Your child will learn how to analyze and interpret data.
Worksheet
Pick a Flower Pictograph
Worksheet
Pick a Flower Pictograph
Find out exactly how many flowers Stefanie has planted with this pictograph for kids. Your child will learn how to analyze and interpret data.
Second Grade
Data and Graphing
Worksheet
Make Predictions Using Theoretical Probability
Interactive Worksheet
Make Predictions Using Theoretical Probability
Seventh Grade
Data and Graphing
In this seventh-grade probability worksheet, students will practice finding the theoretical probabilities for different events and using those to make predictions.
Interactive Worksheet
Make Predictions Using Theoretical Probability
Interactive Worksheet
Make Predictions Using Theoretical Probability
In this seventh-grade probability worksheet, students will practice finding the theoretical probabilities for different events and using those to make predictions.
Seventh Grade
Data and Graphing
Interactive Worksheet
Forms of Entertainment Graph
Worksheet
Forms of Entertainment Graph
Third Grade
Data and Graphing
Poll your friends, family, or classmates to see which kind of entertainment they prefer! This is a fun way for kids to practice collecting data for graphing.
Worksheet
Forms of Entertainment Graph
Worksheet
Forms of Entertainment Graph
Poll your friends, family, or classmates to see which kind of entertainment they prefer! This is a fun way for kids to practice collecting data for graphing.
Third Grade
Data and Graphing
Worksheet
Write Problem Questions for Line Plots
Worksheet
Write Problem Questions for Line Plots
Third Grade
Data and Graphing
Give your students the opportunity to think critically as a mathematician. In this exercise, they will analyze a line plot and create questions about the data.
Worksheet
Write Problem Questions for Line Plots
Worksheet
Write Problem Questions for Line Plots
Give your students the opportunity to think critically as a mathematician. In this exercise, they will analyze a line plot and create questions about the data.
Third Grade
Data and Graphing
Worksheet
Bar Graphing with Roly
Game
Bar Graphing with Roly
Second Grade
Data and Graphing
Stop those germs! Kids must catch germs as they drop and prevent people from getting sick in this icky data and graphing game.
Game
Bar Graphing with Roly
Game
Bar Graphing with Roly
Stop those germs! Kids must catch germs as they drop and prevent people from getting sick in this icky data and graphing game.
Second Grade
Data and Graphing
Game
Graphing Favorite Pets
Worksheet
Graphing Favorite Pets
First Grade
Data and Graphing
Mix up math lessons with this pet-inspired graphing exercise. This is an interactive way to teach your students how to collect data and graph their findings.
Worksheet
Graphing Favorite Pets
Worksheet
Graphing Favorite Pets
Mix up math lessons with this pet-inspired graphing exercise. This is an interactive way to teach your students how to collect data and graph their findings.
First Grade
Data and Graphing
Worksheet
Dot Plots
Worksheet
Dot Plots
Sixth Grade
Data and Graphing
Covering a variety of interesting real-life contexts, this two-page math worksheet gives learners practice turning data sets into dot plots that are representative of each scenario.
Worksheet
Dot Plots
Worksheet
Dot Plots
Covering a variety of interesting real-life contexts, this two-page math worksheet gives learners practice turning data sets into dot plots that are representative of each scenario.
Sixth Grade
Data and Graphing
Worksheet
Make a Picture Graph
Worksheet
Make a Picture Graph
First Grade
Data and Graphing
In this math worksheet, children use picture graphs to tally up the total amounts of baked goods each party purchases.
Worksheet
Make a Picture Graph
Worksheet
Make a Picture Graph
In this math worksheet, children use picture graphs to tally up the total amounts of baked goods each party purchases.
First Grade
Data and Graphing
Worksheet
Graphing Favorite Fruits
Worksheet
Graphing Favorite Fruits
First Grade
Data and Graphing
Ask your students to survey their classmate's favorite fruits. Students will use this worksheet to record data by graphing the fruity answers they receive from classmates.
Worksheet
Graphing Favorite Fruits
Worksheet
Graphing Favorite Fruits
Ask your students to survey their classmate's favorite fruits. Students will use this worksheet to record data by graphing the fruity answers they receive from classmates.
First Grade
Data and Graphing
Worksheet
Flower Pie Chart
Worksheet
Flower Pie Chart
Second Grade
Data and Graphing
Even if your child isn't ready for statistics, he can learn to get his bearings around charts and graphs with this simple flower-themed pie chart worksheet.
Worksheet
Flower Pie Chart
Worksheet
Flower Pie Chart
Even if your child isn't ready for statistics, he can learn to get his bearings around charts and graphs with this simple flower-themed pie chart worksheet.
Second Grade
Data and Graphing
Worksheet
Scatter Plots
Worksheet
Scatter Plots
Eighth Grade
Data and Graphing
Students practice identifying outliers and the types of associations shown on scatter plots in this eighth-grade data and graphing worksheet!
Worksheet
Scatter Plots
Worksheet
Scatter Plots
Students practice identifying outliers and the types of associations shown on scatter plots in this eighth-grade data and graphing worksheet!
Eighth Grade
Data and Graphing
Worksheet
Mighty Mean, Median, and Mode
Lesson Plan
Mighty Mean, Median, and Mode
Fourth Grade
Data and Graphing
Give your students a good basis in interpreting data with this lesson that teaches them about mean, median, and mode with plenty of practice and cute videos to keep them interested.
Lesson Plan
Mighty Mean, Median, and Mode
Lesson Plan
Mighty Mean, Median, and Mode
Give your students a good basis in interpreting data with this lesson that teaches them about mean, median, and mode with plenty of practice and cute videos to keep them interested.
Fourth Grade
Data and Graphing
Lesson Plan
Make Predictions Using Experimental Probability
Interactive Worksheet
Make Predictions Using Experimental Probability
Seventh Grade
Data and Graphing
In this seventh-grade probability worksheet, students are introduced to the concept of experimental probability and shown how to use this information to make predictions.
Interactive Worksheet
Make Predictions Using Experimental Probability
Interactive Worksheet
Make Predictions Using Experimental Probability
In this seventh-grade probability worksheet, students are introduced to the concept of experimental probability and shown how to use this information to make predictions.
Seventh Grade
Data and Graphing
Interactive Worksheet
Word Problems: Interpreting Line Plots
Worksheet
Word Problems: Interpreting Line Plots
Second Grade
Data and Graphing
Students will have a chance to practice solving word problems using line plots with this worksheet.
Worksheet
Word Problems: Interpreting Line Plots
Worksheet
Word Problems: Interpreting Line Plots
Students will have a chance to practice solving word problems using line plots with this worksheet.
Second Grade
Data and Graphing
Worksheet
Pie Chart Practice: Colored Pencils
Worksheet
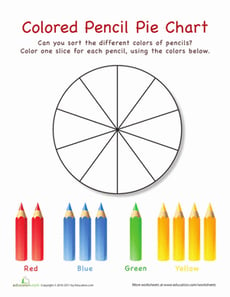
Pie Chart Practice: Colored Pencils
Second Grade
Data and Graphing
Your child might not be ready for statistics, but they can practice using pie charts with this fun, cute worksheet.
Worksheet
Pie Chart Practice: Colored Pencils
Worksheet
Pie Chart Practice: Colored Pencils
Your child might not be ready for statistics, but they can practice using pie charts with this fun, cute worksheet.
Second Grade
Data and Graphing
Worksheet
Reading Pictographs: Eggplant Cooking
Worksheet
Reading Pictographs: Eggplant Cooking
Third Grade
Data and Graphing
Mr. Chef keeps track of how many eggplants he uses with a pictograph. In this worksheet, kids use information in the pictograph to answer word problems.
Worksheet
Reading Pictographs: Eggplant Cooking
Worksheet
Reading Pictographs: Eggplant Cooking
Mr. Chef keeps track of how many eggplants he uses with a pictograph. In this worksheet, kids use information in the pictograph to answer word problems.
Third Grade
Data and Graphing
Worksheet
Math Table
Worksheet
Math Table
Second Grade
Data and Graphing
Help your second grader learn how to read a math table by using this math farm table to answer a set of questions.
Worksheet
Math Table
Worksheet
Math Table
Help your second grader learn how to read a math table by using this math farm table to answer a set of questions.
Second Grade
Data and Graphing
Worksheet
Using Base 10 Drawings in Two-Digit Addition
Worksheet
Using Base 10 Drawings in Two-Digit Addition
Second Grade
Addition
This worksheet teaches you to use base 10 drawings to add two-digit numbers.
Worksheet
Using Base 10 Drawings in Two-Digit Addition
Worksheet
Using Base 10 Drawings in Two-Digit Addition
This worksheet teaches you to use base 10 drawings to add two-digit numbers.
Second Grade
Addition
Worksheet
Graph It! What Kind of Pet Do You Have?
Worksheet
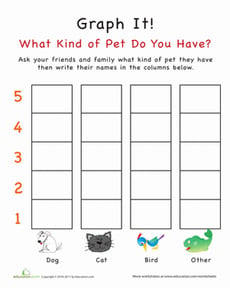
Graph It! What Kind of Pet Do You Have?
Kindergarten
Data and Graphing
This worksheet is perfect for the kid that asks, "When am I ever going to use math?" Conduct a pet survey with your child by using this pet graphing worksheet.
Worksheet
Graph It! What Kind of Pet Do You Have?
Worksheet
Graph It! What Kind of Pet Do You Have?
This worksheet is perfect for the kid that asks, "When am I ever going to use math?" Conduct a pet survey with your child by using this pet graphing worksheet.
Kindergarten
Data and Graphing
Worksheet
Find the Error: Distance Between Two Points
Worksheet
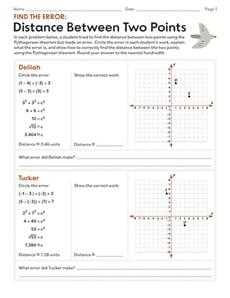
Find the Error: Distance Between Two Points
Eighth Grade
Geometry
Practice using the Pythagorean theorem to find the distance between points on a coordinate plane!
Worksheet
Find the Error: Distance Between Two Points
Worksheet
Find the Error: Distance Between Two Points
Practice using the Pythagorean theorem to find the distance between points on a coordinate plane!
Eighth Grade
Geometry
Worksheet
1
2
3
4
5
6
7