SKIP TO CONTENT
Worksheet Generator
Subjects
Grades
Worksheets
Games
Build a Worksheet
More Resources
Roly Recommends
Subjects
Grades
Worksheets
Games
Build a Worksheet
More Resources
Roly Recommends
All Subjects
Math
Data and Graphing
Subtopics:
Collecting and Organizing Data
Picture Graphs
Bar Graphs
Line Plots
Coordinate Plane
Box Plots
Histograms
Scatter Plots
Show Less
Filters
Search for: the
✕
Math
✕
Common Core
✕
Subjects
Math
English Language Arts
Science
Social Studies
Foreign Language
Grade Level
Pre-K
K
1st
2nd
3rd
4th
5th
6th
7th
8th
Early Childhood
Elementary School
Middle School
Resource Type
Worksheets
Games
Lesson Plans
Interactive Worksheets
Workbooks
Activities
Exercises
Offline Games
Teacher Resources
Occasion
St. Patrick's Day
Easter
Earth Day
Summer
Back to School
Fall
Halloween
Holidays
Thanksgiving
Valentine's Day
Common Core
Yes
Game Type
Printable Board Games
Travel Games
English Language Support
Yes
See More
Clear All
View 323 results
Showing Results for the : Page 8
323 results
Search for: the
✕
Math
✕
Common Core
✕
Clear All
Sort by:
Relevance
Most recent
Most popular
Alphabetical A-Z
Alphabetical Z-A
All filters
323 results
Sort by:
Relevance
Most recent
Most popular
Alphabetical A-Z
Alphabetical Z-A
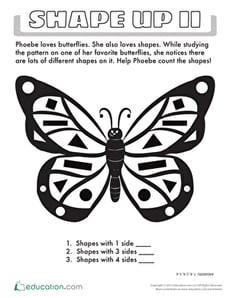
Shape Up II
Worksheet
Shape Up II
Kindergarten
Numbers and Counting
Searching for a worksheet that will help your child with counting and shapes? This printable is perfect for young counters.
Worksheet
Shape Up II
Worksheet
Shape Up II
Searching for a worksheet that will help your child with counting and shapes? This printable is perfect for young counters.
Kindergarten
Numbers and Counting
Worksheet
Mighty Mean, Median, and Mode
Lesson Plan
Mighty Mean, Median, and Mode
Fourth Grade
Data and Graphing
Give your students a good basis in interpreting data with this lesson that teaches them about mean, median, and mode with plenty of practice and cute videos to keep them interested.
Lesson Plan
Mighty Mean, Median, and Mode
Lesson Plan
Mighty Mean, Median, and Mode
Give your students a good basis in interpreting data with this lesson that teaches them about mean, median, and mode with plenty of practice and cute videos to keep them interested.
Fourth Grade
Data and Graphing
Lesson Plan
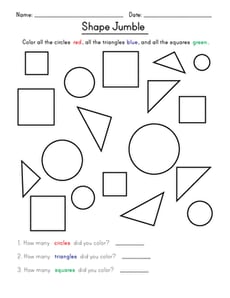
Shape Jumble
Worksheet
Shape Jumble
Kindergarten
Geometry
Help your kindergarten child learn his geometric shapes with this printable coloring worksheet.
Worksheet
Shape Jumble
Worksheet
Shape Jumble
Help your kindergarten child learn his geometric shapes with this printable coloring worksheet.
Kindergarten
Geometry
Worksheet
Interpreting Data Using Graphs
Lesson Plan
Interpreting Data Using Graphs
Kindergarten
Data and Graphing
Engage students in learning about data by analyzing picture graphs, then collecting data from classmates and making their own graphs!
Lesson Plan
Interpreting Data Using Graphs
Lesson Plan
Interpreting Data Using Graphs
Engage students in learning about data by analyzing picture graphs, then collecting data from classmates and making their own graphs!
Kindergarten
Data and Graphing
Lesson Plan
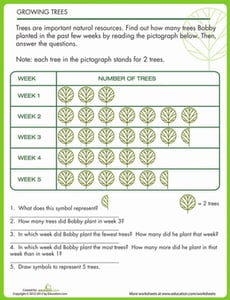
Tree Pictograph
Worksheet
Tree Pictograph
Second Grade
Data and Graphing
Your child can practice basic math and symbol recognition with this pictograph worksheet.
Worksheet
Tree Pictograph
Worksheet
Tree Pictograph
Your child can practice basic math and symbol recognition with this pictograph worksheet.
Second Grade
Data and Graphing
Worksheet
Interpreting Slopes and y-Intercepts of Lines of Best Fit
Worksheet
Interpreting Slopes and y-Intercepts of Lines of Best Fit
Eighth Grade
Algebra
Students interpret slopes and
y
-intercepts of lines of best fit based on real-world scenarios in this eighth-grade worksheet!
Worksheet
Interpreting Slopes and y-Intercepts of Lines of Best Fit
Worksheet
Interpreting Slopes and y-Intercepts of Lines of Best Fit
Students interpret slopes and
y
-intercepts of lines of best fit based on real-world scenarios in this eighth-grade worksheet!
Eighth Grade
Algebra
Worksheet
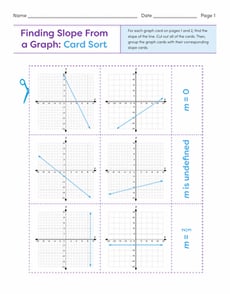
Finding Slope From a Graph: Card Sort
Worksheet
Finding Slope From a Graph: Card Sort
Eighth Grade
Algebra
Use this hands-on card sort activity to give students practice determining slope from a graph!
Worksheet
Finding Slope From a Graph: Card Sort
Worksheet
Finding Slope From a Graph: Card Sort
Use this hands-on card sort activity to give students practice determining slope from a graph!
Eighth Grade
Algebra
Worksheet
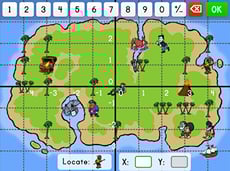
Graphing Points to Find Treasure Part 1
Game
Graphing Points to Find Treasure Part 1
Sixth Grade
Data and Graphing
Learners track down buried treasure by plotting coordinates on a map in this fun-filled math game.
Game
Graphing Points to Find Treasure Part 1
Game
Graphing Points to Find Treasure Part 1
Learners track down buried treasure by plotting coordinates on a map in this fun-filled math game.
Sixth Grade
Data and Graphing
Game
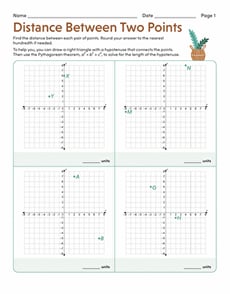
Distance Between Two Points
Worksheet
Distance Between Two Points
Eighth Grade
Geometry
Give your students practice finding diagonal distances between two points with this two-page geometry worksheet!
Worksheet
Distance Between Two Points
Worksheet
Distance Between Two Points
Give your students practice finding diagonal distances between two points with this two-page geometry worksheet!
Eighth Grade
Geometry
Worksheet
Line Plot Fractions
Worksheet
Line Plot Fractions
Fifth Grade
Fractions
Build your students' confidence in using fractions. With this worksheet, students will graph data of snowfall measurements on a line plot.
Worksheet
Line Plot Fractions
Worksheet
Line Plot Fractions
Build your students' confidence in using fractions. With this worksheet, students will graph data of snowfall measurements on a line plot.
Fifth Grade
Fractions
Worksheet
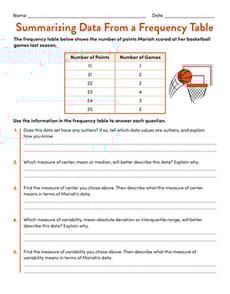
Summarizing Data From a Frequency Table
Worksheet
Summarizing Data From a Frequency Table
Sixth Grade
Data and Graphing
Practice summarizing a numerical data set with this one-page statistics worksheet!
Worksheet
Summarizing Data From a Frequency Table
Worksheet
Summarizing Data From a Frequency Table
Practice summarizing a numerical data set with this one-page statistics worksheet!
Sixth Grade
Data and Graphing
Worksheet
Backyard Bugs
Activity
Backyard Bugs
First Grade
Data and Graphing
Want to boost math and science learning? Take a bug expedition and give your first grader practice observing and charting what they see.
Activity
Backyard Bugs
Activity
Backyard Bugs
Want to boost math and science learning? Take a bug expedition and give your first grader practice observing and charting what they see.
First Grade
Data and Graphing
Activity
Graph Proportional Relationships #2
Worksheet
Graph Proportional Relationships #2
Eighth Grade
Ratios and Proportions
Students practice graphing proportional relationships based on relatable word problems in this eighth-grade math worksheet!
Worksheet
Graph Proportional Relationships #2
Worksheet
Graph Proportional Relationships #2
Students practice graphing proportional relationships based on relatable word problems in this eighth-grade math worksheet!
Eighth Grade
Ratios and Proportions
Worksheet
Using Election Data
Worksheet
Using Election Data
Second Grade
Data and Graphing
Practice reading election data with this data analysis worksheet!
Worksheet
Using Election Data
Worksheet
Using Election Data
Practice reading election data with this data analysis worksheet!
Second Grade
Data and Graphing
Worksheet
Reading Pictographs: Building a New Town
Worksheet
Reading Pictographs: Building a New Town
Third Grade
Data and Graphing
In this 3rd grade math worksheet, kids practice interpreting graph data and using information in a pictograph to answer word problems.
Worksheet
Reading Pictographs: Building a New Town
Worksheet
Reading Pictographs: Building a New Town
In this 3rd grade math worksheet, kids practice interpreting graph data and using information in a pictograph to answer word problems.
Third Grade
Data and Graphing
Worksheet
Feline Delights: Scatter Plots Performance Task
Worksheet
Feline Delights: Scatter Plots Performance Task
Eighth Grade
Algebra
Students apply their knowledge of statistics and probability in a real-world context in this two-page performance task!
Worksheet
Feline Delights: Scatter Plots Performance Task
Worksheet
Feline Delights: Scatter Plots Performance Task
Students apply their knowledge of statistics and probability in a real-world context in this two-page performance task!
Eighth Grade
Algebra
Worksheet
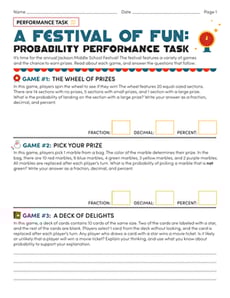
A Festival of Fun: Probability Performance Task
Worksheet
A Festival of Fun: Probability Performance Task
Seventh Grade
Data and Graphing
Students demonstrate their proficiency with probability in this three-page performance task worksheet!
Worksheet
A Festival of Fun: Probability Performance Task
Worksheet
A Festival of Fun: Probability Performance Task
Students demonstrate their proficiency with probability in this three-page performance task worksheet!
Seventh Grade
Data and Graphing
Worksheet
Information Gap Cards: Line Plots
Worksheet
Information Gap Cards: Line Plots
Fifth Grade
Fractions
Students will look at line plots and match information cards with classmates.
Worksheet
Information Gap Cards: Line Plots
Worksheet
Information Gap Cards: Line Plots
Students will look at line plots and match information cards with classmates.
Fifth Grade
Fractions
Worksheet
Constructing Two-Way Relative Frequency Tables
Interactive Worksheet
Constructing Two-Way Relative Frequency Tables
Eighth Grade
Data and Graphing
Practice creating two-way relative frequency tables based on real-world scenarios with this eighth-grade math worksheet!
Interactive Worksheet
Constructing Two-Way Relative Frequency Tables
Interactive Worksheet
Constructing Two-Way Relative Frequency Tables
Practice creating two-way relative frequency tables based on real-world scenarios with this eighth-grade math worksheet!
Eighth Grade
Data and Graphing
Interactive Worksheet
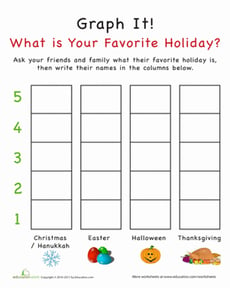
Graph It! What is Your Favorite Holiday?
Worksheet
Graph It! What is Your Favorite Holiday?
Kindergarten
Data and Graphing
Help your child conduct a study, all about his friends' favorite holidays. Our holiday graphing worksheet is a fun way to show your kid practical uses for math.
Worksheet
Graph It! What is Your Favorite Holiday?
Worksheet
Graph It! What is Your Favorite Holiday?
Help your child conduct a study, all about his friends' favorite holidays. Our holiday graphing worksheet is a fun way to show your kid practical uses for math.
Kindergarten
Data and Graphing
Worksheet
Build a Bar Graph: Favorite Wild Animals
Worksheet
Build a Bar Graph: Favorite Wild Animals
Second Grade
Data and Graphing
Analyze a bar graph with this second-grade worksheet!
Worksheet
Build a Bar Graph: Favorite Wild Animals
Worksheet
Build a Bar Graph: Favorite Wild Animals
Analyze a bar graph with this second-grade worksheet!
Second Grade
Data and Graphing
Worksheet
Creating Box Plots
Worksheet
Creating Box Plots
Sixth Grade
Data and Graphing
Learn to draw your own box plots to show data in this informative sixth-grade worksheet!
Worksheet
Creating Box Plots
Worksheet
Creating Box Plots
Learn to draw your own box plots to show data in this informative sixth-grade worksheet!
Sixth Grade
Data and Graphing
Worksheet
Interpreting Line Plots with Fractional Units
Worksheet
Interpreting Line Plots with Fractional Units
Third Grade
Data and Graphing
In this third grade worksheet, kids will interpret a line plot that includes fractional units.
Worksheet
Interpreting Line Plots with Fractional Units
Worksheet
Interpreting Line Plots with Fractional Units
In this third grade worksheet, kids will interpret a line plot that includes fractional units.
Third Grade
Data and Graphing
Worksheet
Box Plots #1
Interactive Worksheet
Box Plots #1
Sixth Grade
Data and Graphing
Practice interpreting box plots with this sixth-grade worksheet!
Interactive Worksheet
Box Plots #1
Interactive Worksheet
Box Plots #1
Practice interpreting box plots with this sixth-grade worksheet!
Sixth Grade
Data and Graphing
Interactive Worksheet
Create Histograms From Data Sets
Worksheet
Create Histograms From Data Sets
Sixth Grade
Data and Graphing
Draw data to show a scientist’s findings in this practical worksheet!
Worksheet
Create Histograms From Data Sets
Worksheet
Create Histograms From Data Sets
Draw data to show a scientist’s findings in this practical worksheet!
Sixth Grade
Data and Graphing
Worksheet
Describing Distributions in Histograms
Worksheet
Describing Distributions in Histograms
Sixth Grade
Data and Graphing
Help students deepen their understanding of histograms with this this two-page data and graphing worksheet!
Worksheet
Describing Distributions in Histograms
Worksheet
Describing Distributions in Histograms
Help students deepen their understanding of histograms with this this two-page data and graphing worksheet!
Sixth Grade
Data and Graphing
Worksheet
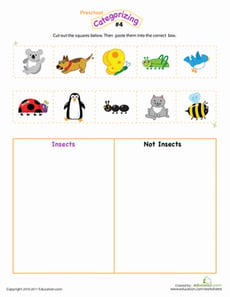
Cut and Categorize #4
Interactive Worksheet
Cut and Categorize #4
Pre-K
Data and Graphing
Which of these cute images are insects, and which are not? Can your preschooler put them into categories?
Interactive Worksheet
Cut and Categorize #4
Interactive Worksheet
Cut and Categorize #4
Which of these cute images are insects, and which are not? Can your preschooler put them into categories?
Pre-K
Data and Graphing
Interactive Worksheet
Creating Histograms From Frequency Tables
Worksheet
Creating Histograms From Frequency Tables
Sixth Grade
Data and Graphing
Practice using histograms to show different sets of data in this engaging sixth-grade worksheet!
Worksheet
Creating Histograms From Frequency Tables
Worksheet
Creating Histograms From Frequency Tables
Practice using histograms to show different sets of data in this engaging sixth-grade worksheet!
Sixth Grade
Data and Graphing
Worksheet
Box Plots #3
Interactive Worksheet
Box Plots #3
Sixth Grade
Data and Graphing
Become an expert at interpreting box plots with this sixth-grade worksheet!
Interactive Worksheet
Box Plots #3
Interactive Worksheet
Box Plots #3
Become an expert at interpreting box plots with this sixth-grade worksheet!
Sixth Grade
Data and Graphing
Interactive Worksheet
From Dot Plots to Histograms
Worksheet
From Dot Plots to Histograms
Sixth Grade
Data and Graphing
Discover different ways to display data in this delightful sixth-grade worksheet!
Worksheet
From Dot Plots to Histograms
Worksheet
From Dot Plots to Histograms
Discover different ways to display data in this delightful sixth-grade worksheet!
Sixth Grade
Data and Graphing
Worksheet
1
…
7
8
9
10
11