SKIP TO CONTENT
Worksheet Generator
Subjects
Grades
Worksheets
Games
Build a Worksheet
More Resources
Roly Recommends
Summer Boost
Subjects
Grades
Worksheets
Games
Build a Worksheet
More Resources
Roly Recommends
Summer Boost
Showing Results for level b books
Filters
Math
Data and Graphing
16 results
Search for: level, b, books
✕
Math
✕
Common Core
✕
Clear all
16 results
Subtopics:
Collecting and Organizing Data
Picture Graphs
Bar Graphs
Coordinate Plane
Scatter Plots
Show Less
Filters
Search for: level, b, books
✕
Math
✕
Common Core
✕
Subjects
Math
English Language Arts
Science
Social Studies
Technology
Grade Level
Pre-K
K
1st
2nd
3rd
4th
5th
6th
7th
8th
Early Childhood
Elementary School
Middle School
Resource Type
Worksheets
Lesson Plans
Interactive Worksheets
Activities
Teacher Resources
Common Core
Yes
English Language Support
Yes
Clear all
View 16 results
Showing Results for level b books
Filters
16 results
Search for: level, b, books
✕
Math
✕
Common Core
✕
Clear all
16 results
Comparing Weight
Worksheet
Comparing Weight
Kindergarten
Numbers and Counting
Take measurement learning to the next level with this comparing weight worksheet featuring common objects, and practice reading numbers.
Worksheet
Comparing Weight
Worksheet
Comparing Weight
Take measurement learning to the next level with this comparing weight worksheet featuring common objects, and practice reading numbers.
Kindergarten
Numbers and Counting
Worksheet
Let's Play Ball
Lesson Plan
Let's Play Ball
Third Grade
Multiplication
Students will have a ball with this data collection lesson plan where they learn about collecting and plotting data on a chart and line plot.
Lesson Plan
Let's Play Ball
Lesson Plan
Let's Play Ball
Students will have a ball with this data collection lesson plan where they learn about collecting and plotting data on a chart and line plot.
Third Grade
Multiplication
Lesson Plan
Insect Counting Worksheet: Wasps and Dragonflies
Worksheet
Insect Counting Worksheet: Wasps and Dragonflies
Kindergarten
Numbers and Counting
Give your kindergartener plenty of counting practice. This counting worksheet, featuring wasps and dragonflies, may even turn your young one into a bug fanatic.
Worksheet
Insect Counting Worksheet: Wasps and Dragonflies
Worksheet
Insect Counting Worksheet: Wasps and Dragonflies
Give your kindergartener plenty of counting practice. This counting worksheet, featuring wasps and dragonflies, may even turn your young one into a bug fanatic.
Kindergarten
Numbers and Counting
Worksheet
Practice Graphs
Worksheet
Practice Graphs
Second Grade
Data and Graphing
Kids practice representing a set of data using three kinds of graphs: a bar graph, pictograph, and pie graph.
Worksheet
Practice Graphs
Worksheet
Practice Graphs
Kids practice representing a set of data using three kinds of graphs: a bar graph, pictograph, and pie graph.
Second Grade
Data and Graphing
Worksheet
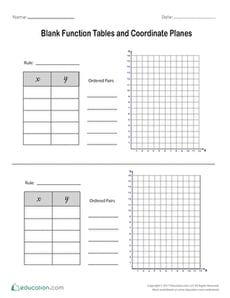
Blank Function Tables and Coordinate Planes
Worksheet
Blank Function Tables and Coordinate Planes
Fifth Grade
Geometry
Ask your students to use these blank function tables and coordinate planes to practice plotting ordered pairs.
Worksheet
Blank Function Tables and Coordinate Planes
Worksheet
Blank Function Tables and Coordinate Planes
Ask your students to use these blank function tables and coordinate planes to practice plotting ordered pairs.
Fifth Grade
Geometry
Worksheet
Experimental Probability
Worksheet
Experimental Probability
Seventh Grade
Data and Graphing
This seventh-grade math worksheet gives students a chance to find experimental probabilities using real-world scenarios in the form of word problems!
Worksheet
Experimental Probability
Worksheet
Experimental Probability
This seventh-grade math worksheet gives students a chance to find experimental probabilities using real-world scenarios in the form of word problems!
Seventh Grade
Data and Graphing
Worksheet
Make Predictions Using Theoretical Probability
Interactive Worksheet
Make Predictions Using Theoretical Probability
Seventh Grade
Data and Graphing
In this seventh-grade probability worksheet, students will practice finding the theoretical probabilities for different events and using those to make predictions.
Interactive Worksheet
Make Predictions Using Theoretical Probability
Interactive Worksheet
Make Predictions Using Theoretical Probability
In this seventh-grade probability worksheet, students will practice finding the theoretical probabilities for different events and using those to make predictions.
Seventh Grade
Data and Graphing
Interactive Worksheet
Make Predictions Using Experimental Probability
Interactive Worksheet
Make Predictions Using Experimental Probability
Seventh Grade
Data and Graphing
In this seventh-grade probability worksheet, students are introduced to the concept of experimental probability and shown how to use this information to make predictions.
Interactive Worksheet
Make Predictions Using Experimental Probability
Interactive Worksheet
Make Predictions Using Experimental Probability
In this seventh-grade probability worksheet, students are introduced to the concept of experimental probability and shown how to use this information to make predictions.
Seventh Grade
Data and Graphing
Interactive Worksheet
Experimental Probability Models
Worksheet
Experimental Probability Models
Seventh Grade
Data and Graphing
Use this seventh-grade math worksheet to introduce students to the concept of experimental probability models.
Worksheet
Experimental Probability Models
Worksheet
Experimental Probability Models
Use this seventh-grade math worksheet to introduce students to the concept of experimental probability models.
Seventh Grade
Data and Graphing
Worksheet
What's the Probability?
Worksheet
What's the Probability?
Seventh Grade
Data and Graphing
This math worksheet offers students hands-on practice in calculating probability through simple, familiar scenarios.
Worksheet
What's the Probability?
Worksheet
What's the Probability?
This math worksheet offers students hands-on practice in calculating probability through simple, familiar scenarios.
Seventh Grade
Data and Graphing
Worksheet
Interpreting Slopes and y-Intercepts of Lines of Best Fit
Worksheet
Interpreting Slopes and y-Intercepts of Lines of Best Fit
Eighth Grade
Algebra
Students interpret slopes and
y
-intercepts of lines of best fit based on real-world scenarios in this eighth-grade worksheet!
Worksheet
Interpreting Slopes and y-Intercepts of Lines of Best Fit
Worksheet
Interpreting Slopes and y-Intercepts of Lines of Best Fit
Students interpret slopes and
y
-intercepts of lines of best fit based on real-world scenarios in this eighth-grade worksheet!
Eighth Grade
Algebra
Worksheet
What is it Telling Me? Creating and Interpreting Line Plots
Lesson Plan
What is it Telling Me? Creating and Interpreting Line Plots
Third Grade
Data and Graphing
Line plots are a great way to introduce your students to graphing data. In this lesson, your students will learn how to create a line plot and also practice interpreting line plots.
Lesson Plan
What is it Telling Me? Creating and Interpreting Line Plots
Lesson Plan
What is it Telling Me? Creating and Interpreting Line Plots
Line plots are a great way to introduce your students to graphing data. In this lesson, your students will learn how to create a line plot and also practice interpreting line plots.
Third Grade
Data and Graphing
Lesson Plan
Mighty Mean, Median, and Mode
Lesson Plan
Mighty Mean, Median, and Mode
Fourth Grade
Data and Graphing
Give your students a good basis in interpreting data with this lesson that teaches them about mean, median, and mode with plenty of practice and cute videos to keep them interested.
Lesson Plan
Mighty Mean, Median, and Mode
Lesson Plan
Mighty Mean, Median, and Mode
Give your students a good basis in interpreting data with this lesson that teaches them about mean, median, and mode with plenty of practice and cute videos to keep them interested.
Fourth Grade
Data and Graphing
Lesson Plan
Graphing Colored Counters
Lesson Plan
Graphing Colored Counters
Kindergarten
Data and Graphing
In this lesson, your students will use the background knowledge that they have about counting and sorting to graph data. They will practice answering questions about the graph!
Lesson Plan
Graphing Colored Counters
Lesson Plan
Graphing Colored Counters
In this lesson, your students will use the background knowledge that they have about counting and sorting to graph data. They will practice answering questions about the graph!
Kindergarten
Data and Graphing
Lesson Plan
Bar Graphs: Interpreting Data
Lesson Plan
Bar Graphs: Interpreting Data
Second Grade
Data and Graphing
In this lesson, students will make bar graphs and interpret data using real-life data from other students. They will get practice writing and answering survey questions.
Lesson Plan
Bar Graphs: Interpreting Data
Lesson Plan
Bar Graphs: Interpreting Data
In this lesson, students will make bar graphs and interpret data using real-life data from other students. They will get practice writing and answering survey questions.
Second Grade
Data and Graphing
Lesson Plan
Why Do Leaves Change Color?
Activity
Why Do Leaves Change Color?
Second Grade
Data and Graphing
Engage your children with this fun fall activity that integrates math and science. First, your child will excavate to find leaves. Next, they'll examine them to determine the colors. Then, your child will graph their findings.
Activity
Why Do Leaves Change Color?
Activity
Why Do Leaves Change Color?
Engage your children with this fun fall activity that integrates math and science. First, your child will excavate to find leaves. Next, they'll examine them to determine the colors. Then, your child will graph their findings.
Second Grade
Data and Graphing
Activity
1