SKIP TO CONTENT
Worksheet Generator
Subjects
Grades
Worksheets
Games
Build a Worksheet
More Resources
Roly Recommends
Summer Boost
Subjects
Grades
Worksheets
Games
Build a Worksheet
More Resources
Roly Recommends
Summer Boost
Showing Results for show
Filters
Math
Data and Graphing
32 results
Search for: show
✕
Math
✕
Common Core
✕
Clear all
32 results
Subtopics:
Collecting and Organizing Data
Picture Graphs
Bar Graphs
Line Plots
Coordinate Plane
Box Plots
Histograms
Scatter Plots
Show Less
Filters
Search for: show
✕
Math
✕
Common Core
✕
Subjects
Math
English Language Arts
Science
Social Studies
Technology
Grade Level
Pre-K
K
1st
2nd
3rd
4th
5th
6th
7th
8th
Early Childhood
Elementary School
Middle School
Resource Type
Worksheets
Lesson Plans
Interactive Worksheets
Activities
Occasion
Summer
Valentine's Day
Common Core
Yes
English Language Support
Yes
Clear all
View 32 results
Showing Results for show
Filters
32 results
Search for: show
✕
Math
✕
Common Core
✕
Clear all
32 results
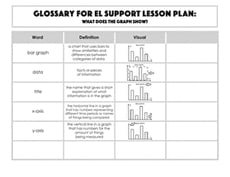
Glossary: What Does the Graph Show?
Worksheet
Glossary: What Does the Graph Show?
Third Grade
Data and Graphing
Glossary: What Does the Graph Show?
Worksheet
Glossary: What Does the Graph Show?
Worksheet
Glossary: What Does the Graph Show?
Glossary: What Does the Graph Show?
Third Grade
Data and Graphing
Worksheet
Vocabulary Cards: What Does the Graph Show?
Worksheet
Vocabulary Cards: What Does the Graph Show?
Third Grade
Data and Graphing
Use these vocabulary cards with the EL Support Lesson: What Does the Graph Show?
Worksheet
Vocabulary Cards: What Does the Graph Show?
Worksheet
Vocabulary Cards: What Does the Graph Show?
Use these vocabulary cards with the EL Support Lesson: What Does the Graph Show?
Third Grade
Data and Graphing
Worksheet
Create Histograms From Data Sets
Worksheet
Create Histograms From Data Sets
Sixth Grade
Data and Graphing
Draw data to show a scientist’s findings in this practical worksheet!
Worksheet
Create Histograms From Data Sets
Worksheet
Create Histograms From Data Sets
Draw data to show a scientist’s findings in this practical worksheet!
Sixth Grade
Data and Graphing
Worksheet
Creating Histograms From Frequency Tables
Worksheet
Creating Histograms From Frequency Tables
Sixth Grade
Data and Graphing
Practice using histograms to show different sets of data in this engaging sixth-grade worksheet!
Worksheet
Creating Histograms From Frequency Tables
Worksheet
Creating Histograms From Frequency Tables
Practice using histograms to show different sets of data in this engaging sixth-grade worksheet!
Sixth Grade
Data and Graphing
Worksheet
Creating Box Plots
Worksheet
Creating Box Plots
Sixth Grade
Data and Graphing
Learn to draw your own box plots to show data in this informative sixth-grade worksheet!
Worksheet
Creating Box Plots
Worksheet
Creating Box Plots
Learn to draw your own box plots to show data in this informative sixth-grade worksheet!
Sixth Grade
Data and Graphing
Worksheet
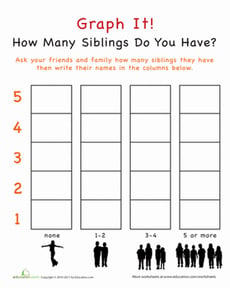
Graph It! How Many Siblings Do You Have?
Worksheet
Graph It! How Many Siblings Do You Have?
Kindergarten
Data and Graphing
Use this Graph It! worksheet to show your child the practical side of math. This graphing exercise gets your child to survey his friends on their siblings.
Worksheet
Graph It! How Many Siblings Do You Have?
Worksheet
Graph It! How Many Siblings Do You Have?
Use this Graph It! worksheet to show your child the practical side of math. This graphing exercise gets your child to survey his friends on their siblings.
Kindergarten
Data and Graphing
Worksheet
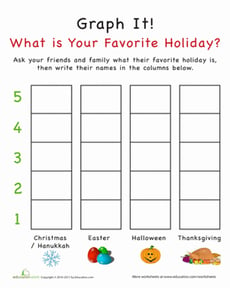
Graph It! What is Your Favorite Holiday?
Worksheet
Graph It! What is Your Favorite Holiday?
Kindergarten
Data and Graphing
Help your child conduct a study, all about his friends' favorite holidays. Our holiday graphing worksheet is a fun way to show your kid practical uses for math.
Worksheet
Graph It! What is Your Favorite Holiday?
Worksheet
Graph It! What is Your Favorite Holiday?
Help your child conduct a study, all about his friends' favorite holidays. Our holiday graphing worksheet is a fun way to show your kid practical uses for math.
Kindergarten
Data and Graphing
Worksheet
Graph My Design
Worksheet
Graph My Design
First Grade
Data and Graphing
Students build a design and then use this bar graph to show how many of each shape was used. Place inside a sheet protector to reuse.
Worksheet
Graph My Design
Worksheet
Graph My Design
Students build a design and then use this bar graph to show how many of each shape was used. Place inside a sheet protector to reuse.
First Grade
Data and Graphing
Worksheet
Picnic Bar Graph
Worksheet
Picnic Bar Graph
Second Grade
Data and Graphing
Which picnic games do you prefer? This bar graph shows some of the most popular picnic activities. Students will learn about analyzing data from a bar graph.
Worksheet
Picnic Bar Graph
Worksheet
Picnic Bar Graph
Which picnic games do you prefer? This bar graph shows some of the most popular picnic activities. Students will learn about analyzing data from a bar graph.
Second Grade
Data and Graphing
Worksheet
How Do You Measure Up?
Worksheet
How Do You Measure Up?
Fifth Grade
Fractions
Students will take practice measurements of real world objects and make a line plot of the data.
Worksheet
How Do You Measure Up?
Worksheet
How Do You Measure Up?
Students will take practice measurements of real world objects and make a line plot of the data.
Fifth Grade
Fractions
Worksheet
Create a Line Plot with Data Provided
Worksheet
Create a Line Plot with Data Provided
Third Grade
Data and Graphing
Use the data provided to have your students create a line plot that reflects how much TV watched per week for one third grade class.
Worksheet
Create a Line Plot with Data Provided
Worksheet
Create a Line Plot with Data Provided
Use the data provided to have your students create a line plot that reflects how much TV watched per week for one third grade class.
Third Grade
Data and Graphing
Worksheet
Graphing Colored Counters
Lesson Plan
Graphing Colored Counters
Kindergarten
Data and Graphing
In this lesson, your students will use the background knowledge that they have about counting and sorting to graph data. They will practice answering questions about the graph!
Lesson Plan
Graphing Colored Counters
Lesson Plan
Graphing Colored Counters
In this lesson, your students will use the background knowledge that they have about counting and sorting to graph data. They will practice answering questions about the graph!
Kindergarten
Data and Graphing
Lesson Plan
Constructing Scatter Plots
Worksheet
Constructing Scatter Plots
Eighth Grade
Data and Graphing
Get students creating scatter plots using real-world data sets with this eighth-grade math worksheet!
Worksheet
Constructing Scatter Plots
Worksheet
Constructing Scatter Plots
Get students creating scatter plots using real-world data sets with this eighth-grade math worksheet!
Eighth Grade
Data and Graphing
Worksheet
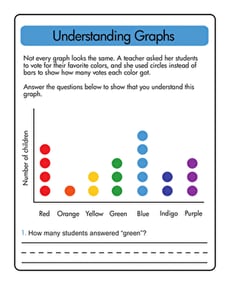
Understanding Graphs
Worksheet
Understanding Graphs
First Grade
Data and Graphing
Test your first grader's understanding of graphs and the information they provide with this worksheet.
Worksheet
Understanding Graphs
Worksheet
Understanding Graphs
Test your first grader's understanding of graphs and the information they provide with this worksheet.
First Grade
Data and Graphing
Worksheet
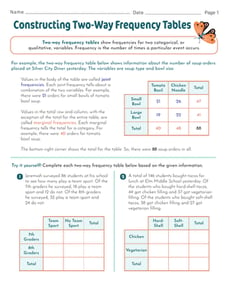
Constructing Two-Way Frequency Tables
Interactive Worksheet
Constructing Two-Way Frequency Tables
Eighth Grade
Data and Graphing
In this eighth-grade math worksheet, learners will then get to practice constructing two-way frequency tables given written descriptions of real-world data.
Interactive Worksheet
Constructing Two-Way Frequency Tables
Interactive Worksheet
Constructing Two-Way Frequency Tables
In this eighth-grade math worksheet, learners will then get to practice constructing two-way frequency tables given written descriptions of real-world data.
Eighth Grade
Data and Graphing
Interactive Worksheet
Estimating Lines of Best Fit
Worksheet
Estimating Lines of Best Fit
Eighth Grade
Data and Graphing
Students estimate and sketch lines of best fit on various scatter plots and describe the association displayed on each.
Worksheet
Estimating Lines of Best Fit
Worksheet
Estimating Lines of Best Fit
Students estimate and sketch lines of best fit on various scatter plots and describe the association displayed on each.
Eighth Grade
Data and Graphing
Worksheet
Reading a Bar Graph: Number of Athletes
Worksheet
Reading a Bar Graph: Number of Athletes
Third Grade
Data and Graphing
In this sports-themed worksheet, children use a bar graph to answer six questions about the number of athletes playing at a time in a variety of sporting events.
Worksheet
Reading a Bar Graph: Number of Athletes
Worksheet
Reading a Bar Graph: Number of Athletes
In this sports-themed worksheet, children use a bar graph to answer six questions about the number of athletes playing at a time in a variety of sporting events.
Third Grade
Data and Graphing
Worksheet
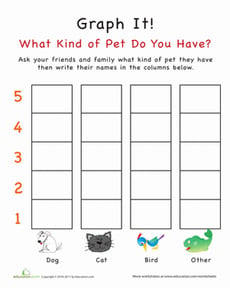
Graph It! What Kind of Pet Do You Have?
Worksheet
Graph It! What Kind of Pet Do You Have?
Kindergarten
Data and Graphing
This worksheet is perfect for the kid that asks, "When am I ever going to use math?" Conduct a pet survey with your child by using this pet graphing worksheet.
Worksheet
Graph It! What Kind of Pet Do You Have?
Worksheet
Graph It! What Kind of Pet Do You Have?
This worksheet is perfect for the kid that asks, "When am I ever going to use math?" Conduct a pet survey with your child by using this pet graphing worksheet.
Kindergarten
Data and Graphing
Worksheet
Graph It! What Color is Your Hair?
Worksheet
Graph It! What Color is Your Hair?
Kindergarten
Data and Graphing
Your child will use his math know-how in a practical situation with this Graph It! worksheet. Your child will use graphing skills to chart friends' hair colors.
Worksheet
Graph It! What Color is Your Hair?
Worksheet
Graph It! What Color is Your Hair?
Your child will use his math know-how in a practical situation with this Graph It! worksheet. Your child will use graphing skills to chart friends' hair colors.
Kindergarten
Data and Graphing
Worksheet
Let's Play Ball
Lesson Plan
Let's Play Ball
Third Grade
Multiplication
Students will have a ball with this data collection lesson plan where they learn about collecting and plotting data on a chart and line plot.
Lesson Plan
Let's Play Ball
Lesson Plan
Let's Play Ball
Students will have a ball with this data collection lesson plan where they learn about collecting and plotting data on a chart and line plot.
Third Grade
Multiplication
Lesson Plan
Backyard Bugs
Activity
Backyard Bugs
First Grade
Data and Graphing
Want to boost math and science learning? Take a bug expedition and give your first grader practice observing and charting what they see.
Activity
Backyard Bugs
Activity
Backyard Bugs
Want to boost math and science learning? Take a bug expedition and give your first grader practice observing and charting what they see.
First Grade
Data and Graphing
Activity
Scatter Plots
Worksheet
Scatter Plots
Eighth Grade
Data and Graphing
Students practice identifying outliers and the types of associations shown on scatter plots in this eighth-grade data and graphing worksheet!
Worksheet
Scatter Plots
Worksheet
Scatter Plots
Students practice identifying outliers and the types of associations shown on scatter plots in this eighth-grade data and graphing worksheet!
Eighth Grade
Data and Graphing
Worksheet
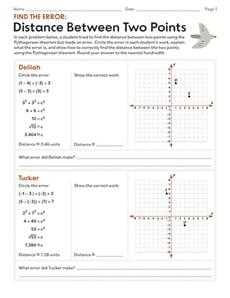
Find the Error: Distance Between Two Points
Worksheet
Find the Error: Distance Between Two Points
Eighth Grade
Geometry
Practice using the Pythagorean theorem to find the distance between points on a coordinate plane!
Worksheet
Find the Error: Distance Between Two Points
Worksheet
Find the Error: Distance Between Two Points
Practice using the Pythagorean theorem to find the distance between points on a coordinate plane!
Eighth Grade
Geometry
Worksheet
Let's Draw: Create Line Plots
Worksheet
Let's Draw: Create Line Plots
Sixth Grade
Data and Graphing
Use data from a farmers' market to create your own line plots in this sixth-grade worksheet!
Worksheet
Let's Draw: Create Line Plots
Worksheet
Let's Draw: Create Line Plots
Use data from a farmers' market to create your own line plots in this sixth-grade worksheet!
Sixth Grade
Data and Graphing
Worksheet
From Dot Plots to Histograms
Worksheet
From Dot Plots to Histograms
Sixth Grade
Data and Graphing
Discover different ways to display data in this delightful sixth-grade worksheet!
Worksheet
From Dot Plots to Histograms
Worksheet
From Dot Plots to Histograms
Discover different ways to display data in this delightful sixth-grade worksheet!
Sixth Grade
Data and Graphing
Worksheet
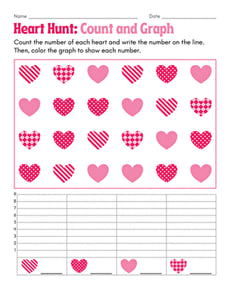
Heart Hunt: Count and Graph
Worksheet
Heart Hunt: Count and Graph
Kindergarten
Numbers and Counting
Hunt for decorative hearts in this Valentine’s Day-themed graphing worksheet for kindergarteners and first graders!
Worksheet
Heart Hunt: Count and Graph
Worksheet
Heart Hunt: Count and Graph
Hunt for decorative hearts in this Valentine’s Day-themed graphing worksheet for kindergarteners and first graders!
Kindergarten
Numbers and Counting
Worksheet
Tally Chart: At the Sushi Counter
Worksheet
Tally Chart: At the Sushi Counter
First Grade
Data and Graphing
The chef made a lot of sushi today during lunch. Can your child help him figure out how much sushi he made by filling in the table with tally marks?
Worksheet
Tally Chart: At the Sushi Counter
Worksheet
Tally Chart: At the Sushi Counter
The chef made a lot of sushi today during lunch. Can your child help him figure out how much sushi he made by filling in the table with tally marks?
First Grade
Data and Graphing
Worksheet
Let's Graph Our Fall Favorites!
Lesson Plan
Let's Graph Our Fall Favorites!
Second Grade
Data and Graphing
This engaging math lesson combines all of your kid's fall favorites as they learn to represent data using a bar graph.
Lesson Plan
Let's Graph Our Fall Favorites!
Lesson Plan
Let's Graph Our Fall Favorites!
This engaging math lesson combines all of your kid's fall favorites as they learn to represent data using a bar graph.
Second Grade
Data and Graphing
Lesson Plan
Interpreting Data Using Graphs
Lesson Plan
Interpreting Data Using Graphs
Kindergarten
Data and Graphing
Engage students in learning about data by analyzing picture graphs, then collecting data from classmates and making their own graphs!
Lesson Plan
Interpreting Data Using Graphs
Lesson Plan
Interpreting Data Using Graphs
Engage students in learning about data by analyzing picture graphs, then collecting data from classmates and making their own graphs!
Kindergarten
Data and Graphing
Lesson Plan
Bar Graphs: Interpreting Data
Lesson Plan
Bar Graphs: Interpreting Data
Second Grade
Data and Graphing
In this lesson, students will make bar graphs and interpret data using real-life data from other students. They will get practice writing and answering survey questions.
Lesson Plan
Bar Graphs: Interpreting Data
Lesson Plan
Bar Graphs: Interpreting Data
In this lesson, students will make bar graphs and interpret data using real-life data from other students. They will get practice writing and answering survey questions.
Second Grade
Data and Graphing
Lesson Plan
1
2