SKIP TO CONTENT
Worksheet Generator
Subjects
Grades
Worksheets
Games
Build a Worksheet
More Resources
Roly Recommends
Summer Boost
Subjects
Grades
Worksheets
Games
Build a Worksheet
More Resources
Roly Recommends
Summer Boost
Showing Results for data driven instruction : Page 2
Filters
Math
Data and Graphing
255 results
Search for: data, driven, instruction
✕
Math
✕
Clear all
255 results
Subtopics:
Collecting and Organizing Data
Picture Graphs
Bar Graphs
Line Plots
Coordinate Plane
Box Plots
Histograms
Scatter Plots
Show Less
Filters
Search for: data, driven, instruction
✕
Math
✕
Subjects
Math
English Language Arts
Science
Social Studies
Foreign Language
Technology
Grade Level
Pre-K
K
1st
2nd
3rd
4th
5th
6th
7th
8th
Early Childhood
Elementary School
Middle School
Resource Type
Worksheets
Games
Lesson Plans
Interactive Worksheets
Workbooks
Activities
Exercises
Offline Games
Guided Lessons
Teacher Resources
Occasion
Birthdays
Summer
Back to School
Halloween
Winter
Holidays
Valentine's Day
Common Core
Yes
Game Type
Ball Games
English Language Support
Yes
Clear all
View 255 results
Showing Results for data driven instruction : Page 2
Filters
255 results
Search for: data, driven, instruction
✕
Math
✕
Clear all
255 results
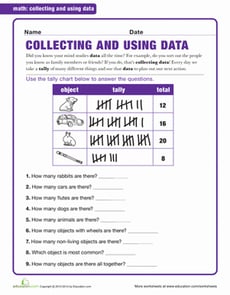
Using Data
Worksheet
Using Data
First Grade
Data and Graphing
This worksheet provides excellent practice adding, interpreting, and organizing information.
Worksheet
Using Data
Worksheet
Using Data
This worksheet provides excellent practice adding, interpreting, and organizing information.
First Grade
Data and Graphing
Worksheet
Graphing Data: Colors
Worksheet
Graphing Data: Colors
Second Grade
Data and Graphing
Help the concept of graphing really sink in by challenging your second grader to graph kids' favorite colors using a table, tally mark table, and grid.
Worksheet
Graphing Data: Colors
Worksheet
Graphing Data: Colors
Help the concept of graphing really sink in by challenging your second grader to graph kids' favorite colors using a table, tally mark table, and grid.
Second Grade
Data and Graphing
Worksheet
Drawing Inferences Using Data
Worksheet
Drawing Inferences Using Data
Seventh Grade
Data and Graphing
Students compare different survey methods to make inferences about how much time students at a school spend playing video games in this seventh-grade math worksheet.
Worksheet
Drawing Inferences Using Data
Worksheet
Drawing Inferences Using Data
Students compare different survey methods to make inferences about how much time students at a school spend playing video games in this seventh-grade math worksheet.
Seventh Grade
Data and Graphing
Worksheet
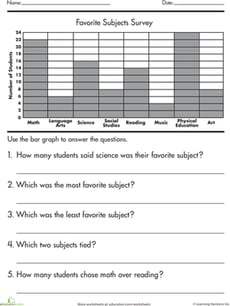
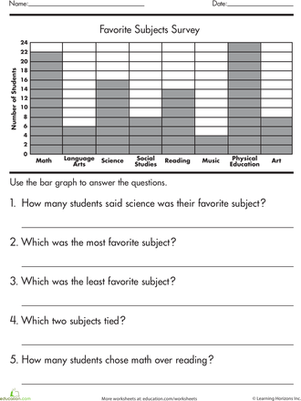
Graphing Survey Data
Worksheet
Graphing Survey Data
Second Grade
Data and Graphing
If your second grader is stumped by bar graphs, clear up the confusion with this worksheet that helps kids learn how to read and interpret a bar graph.
Worksheet
Graphing Survey Data
Worksheet
Graphing Survey Data
If your second grader is stumped by bar graphs, clear up the confusion with this worksheet that helps kids learn how to read and interpret a bar graph.
Second Grade
Data and Graphing
Worksheet
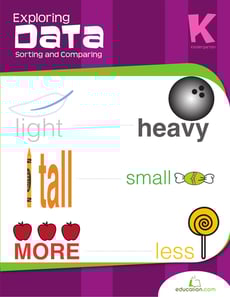
Exploring Data: Sorting and Comparing
Workbook
Exploring Data: Sorting and Comparing
Kindergarten
Numbers and Counting
There is a mix of objects in this workbook and it's up to your child to sort them by colors, shapes and sizes. Plus, he'll practice identifying weight and making simple comparisons.
Workbook
Exploring Data: Sorting and Comparing
Workbook
Exploring Data: Sorting and Comparing
There is a mix of objects in this workbook and it's up to your child to sort them by colors, shapes and sizes. Plus, he'll practice identifying weight and making simple comparisons.
Kindergarten
Numbers and Counting
Workbook
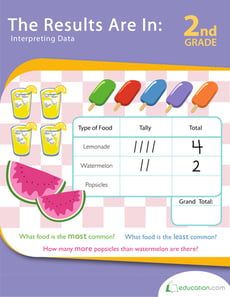
The Results Are In: Interpreting Data
Workbook
The Results Are In: Interpreting Data
Second Grade
Data and Graphing
Pictures and information go hand-in-hand in this workbook. Take a bite out of simple graphing and savor the math!
Workbook
The Results Are In: Interpreting Data
Workbook
The Results Are In: Interpreting Data
Pictures and information go hand-in-hand in this workbook. Take a bite out of simple graphing and savor the math!
Second Grade
Data and Graphing
Workbook
Practice Finding Range
Worksheet
Practice Finding Range
Sixth Grade
Data and Graphing
Give your students practice finding the range of a data set with this sixth-grade data and graphing worksheet!
Worksheet
Practice Finding Range
Worksheet
Practice Finding Range
Give your students practice finding the range of a data set with this sixth-grade data and graphing worksheet!
Sixth Grade
Data and Graphing
Worksheet
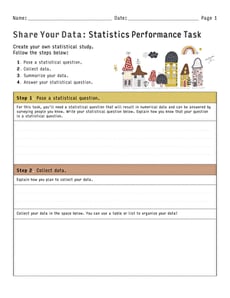
Share Your Data: Statistics Performance Task
Worksheet
Share Your Data: Statistics Performance Task
Sixth Grade
Data and Graphing
Create your own statistical study with this open-ended math worksheet for sixth graders!
Worksheet
Share Your Data: Statistics Performance Task
Worksheet
Share Your Data: Statistics Performance Task
Create your own statistical study with this open-ended math worksheet for sixth graders!
Sixth Grade
Data and Graphing
Worksheet
Histograms
Worksheet
Histograms
Sixth Grade
Data and Graphing
In this sixth-grade data and graphing worksheet, students will complete histograms from given data sets and frequency tables.
Worksheet
Histograms
Worksheet
Histograms
In this sixth-grade data and graphing worksheet, students will complete histograms from given data sets and frequency tables.
Sixth Grade
Data and Graphing
Worksheet
Do We Wear the Same Colors?
Activity
Do We Wear the Same Colors?
Third Grade
Data and Graphing
Hone observational skills and introduce the basics of data interpretation with this data gathering activity all about the different colors people wear.
Activity
Do We Wear the Same Colors?
Activity
Do We Wear the Same Colors?
Hone observational skills and introduce the basics of data interpretation with this data gathering activity all about the different colors people wear.
Third Grade
Data and Graphing
Activity
Let's Play Ball
Lesson Plan
Let's Play Ball
Third Grade
Multiplication
Students will have a ball with this data collection lesson plan where they learn about collecting and plotting data on a chart and line plot.
Lesson Plan
Let's Play Ball
Lesson Plan
Let's Play Ball
Students will have a ball with this data collection lesson plan where they learn about collecting and plotting data on a chart and line plot.
Third Grade
Multiplication
Lesson Plan
Ice Cream Bar Graph #3
Worksheet
Ice Cream Bar Graph #3
First Grade
Data and Graphing
Practice graphing data with Sam, Kate and Becky as they sell ice cream cones! Keep track of their sales by putting the data into a bar graph.
Worksheet
Ice Cream Bar Graph #3
Worksheet
Ice Cream Bar Graph #3
Practice graphing data with Sam, Kate and Becky as they sell ice cream cones! Keep track of their sales by putting the data into a bar graph.
First Grade
Data and Graphing
Worksheet
Pictograph Graph: Mr. Postman
Worksheet
Pictograph Graph: Mr. Postman
Second Grade
Data and Graphing
Boost your child's data know-how with a lesson on reading and understanding a math pictograph, a kind of graph in which pictures stand in for number data.
Worksheet
Pictograph Graph: Mr. Postman
Worksheet
Pictograph Graph: Mr. Postman
Boost your child's data know-how with a lesson on reading and understanding a math pictograph, a kind of graph in which pictures stand in for number data.
Second Grade
Data and Graphing
Worksheet
Ice Cream Graph #18
Worksheet
Ice Cream Graph #18
First Grade
Data and Graphing
Practice graphing data with Sam, Kate and Becky as they sell ice cream cones! Your child will keep track of their sales by drawing the data into a pictograph.
Worksheet
Ice Cream Graph #18
Worksheet
Ice Cream Graph #18
Practice graphing data with Sam, Kate and Becky as they sell ice cream cones! Your child will keep track of their sales by drawing the data into a pictograph.
First Grade
Data and Graphing
Worksheet
Ice Cream Graph #13
Worksheet
Ice Cream Graph #13
First Grade
Data and Graphing
Practice graphing data with Sam, Kate and Becky as they sell ice cream cones! Your child will keep track of their sales by putting the data into a pictograph.
Worksheet
Ice Cream Graph #13
Worksheet
Ice Cream Graph #13
Practice graphing data with Sam, Kate and Becky as they sell ice cream cones! Your child will keep track of their sales by putting the data into a pictograph.
First Grade
Data and Graphing
Worksheet
Creating a Bar Graph: Favorite Picnic Spots
Worksheet
Creating a Bar Graph: Favorite Picnic Spots
Second Grade
Data and Graphing
Learners practice charting and graphing data in this hands-on worksheet.
Worksheet
Creating a Bar Graph: Favorite Picnic Spots
Worksheet
Creating a Bar Graph: Favorite Picnic Spots
Learners practice charting and graphing data in this hands-on worksheet.
Second Grade
Data and Graphing
Worksheet
Ice Cream Bar Graph #8
Worksheet
Ice Cream Bar Graph #8
First Grade
Data and Graphing
Practice graphing data with Sam, Kate and Becky as they sell ice cream cones! Your child will keep track of their sales by putting the data into a bar graph.
Worksheet
Ice Cream Bar Graph #8
Worksheet
Ice Cream Bar Graph #8
Practice graphing data with Sam, Kate and Becky as they sell ice cream cones! Your child will keep track of their sales by putting the data into a bar graph.
First Grade
Data and Graphing
Worksheet
Create a Line Plot (With Your Own Data!)
Worksheet
Create a Line Plot (With Your Own Data!)
Second Grade
Data and Graphing
Invite students to become researchers with this open-ended line plot template!
Worksheet
Create a Line Plot (With Your Own Data!)
Worksheet
Create a Line Plot (With Your Own Data!)
Invite students to become researchers with this open-ended line plot template!
Second Grade
Data and Graphing
Worksheet
From Dot Plots to Histograms
Worksheet
From Dot Plots to Histograms
Sixth Grade
Data and Graphing
Discover different ways to display data in this delightful sixth-grade worksheet!
Worksheet
From Dot Plots to Histograms
Worksheet
From Dot Plots to Histograms
Discover different ways to display data in this delightful sixth-grade worksheet!
Sixth Grade
Data and Graphing
Worksheet
What Do We Know About Vegetables?
Worksheet
What Do We Know About Vegetables?
First Grade
Data and Graphing
This math worksheet asks students to problem solve using data. Students will satisfy their math appetite by counting, adding, and problem solving using the vegetable data in a bar graph.
Worksheet
What Do We Know About Vegetables?
Worksheet
What Do We Know About Vegetables?
This math worksheet asks students to problem solve using data. Students will satisfy their math appetite by counting, adding, and problem solving using the vegetable data in a bar graph.
First Grade
Data and Graphing
Worksheet
Tally It Up at the Grocery Store!
Worksheet
Tally It Up at the Grocery Store!
First Grade
Data and Graphing
Kids organize and tally up a grocery haul in this data worksheet.
Worksheet
Tally It Up at the Grocery Store!
Worksheet
Tally It Up at the Grocery Store!
Kids organize and tally up a grocery haul in this data worksheet.
First Grade
Data and Graphing
Worksheet
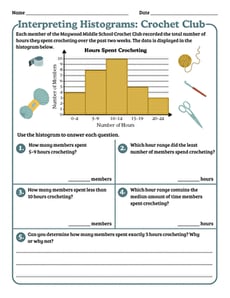
Interpreting Histograms
Worksheet
Interpreting Histograms
Sixth Grade
Data and Graphing
Get “hooked” on decoding data with this fun histogram worksheet!
Worksheet
Interpreting Histograms
Worksheet
Interpreting Histograms
Get “hooked” on decoding data with this fun histogram worksheet!
Sixth Grade
Data and Graphing
Worksheet
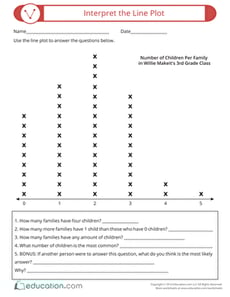
Interpret the Line Plot
Worksheet
Interpret the Line Plot
Second Grade
Data and Graphing
Students will get important practice analyzing line plots in this graphing and data worksheet.
Worksheet
Interpret the Line Plot
Worksheet
Interpret the Line Plot
Students will get important practice analyzing line plots in this graphing and data worksheet.
Second Grade
Data and Graphing
Worksheet
Measurement and Graphing 1
Exercise
Measurement and Graphing 1
Third Grade
Fractions
This exercise will introduce students to the concept of taking measurements and graphing the data.
Exercise
Measurement and Graphing 1
Exercise
Measurement and Graphing 1
This exercise will introduce students to the concept of taking measurements and graphing the data.
Third Grade
Fractions
Exercise
Describing Distributions in Histograms
Worksheet
Describing Distributions in Histograms
Sixth Grade
Data and Graphing
Help students deepen their understanding of histograms with this this two-page data and graphing worksheet!
Worksheet
Describing Distributions in Histograms
Worksheet
Describing Distributions in Histograms
Help students deepen their understanding of histograms with this this two-page data and graphing worksheet!
Sixth Grade
Data and Graphing
Worksheet
Beginning Bar Graphs: Favorite Sports
Worksheet
Beginning Bar Graphs: Favorite Sports
First Grade
Data and Graphing
This worksheet is a fun, hands on way to practice beginning data and graphing skills.
Worksheet
Beginning Bar Graphs: Favorite Sports
Worksheet
Beginning Bar Graphs: Favorite Sports
This worksheet is a fun, hands on way to practice beginning data and graphing skills.
First Grade
Data and Graphing
Worksheet
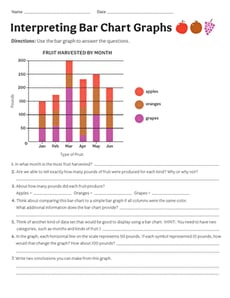
Interpreting Bar Chart Graphs
Worksheet
Interpreting Bar Chart Graphs
Fifth Grade
Data and Graphing
Learners practice using a bar graph to answer questions in this data and graphing worksheet.
Worksheet
Interpreting Bar Chart Graphs
Worksheet
Interpreting Bar Chart Graphs
Learners practice using a bar graph to answer questions in this data and graphing worksheet.
Fifth Grade
Data and Graphing
Worksheet
Creating Histograms From Frequency Tables
Worksheet
Creating Histograms From Frequency Tables
Sixth Grade
Data and Graphing
Practice using histograms to show different sets of data in this engaging sixth-grade worksheet!
Worksheet
Creating Histograms From Frequency Tables
Worksheet
Creating Histograms From Frequency Tables
Practice using histograms to show different sets of data in this engaging sixth-grade worksheet!
Sixth Grade
Data and Graphing
Worksheet
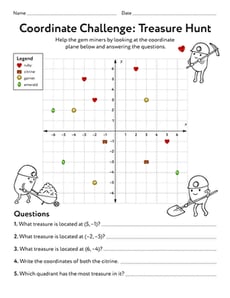
Coordinate Challenge: Treasure Hunt!
Worksheet
Coordinate Challenge: Treasure Hunt!
Sixth Grade
Data and Graphing
Sixth graders will mine four quadrants for gems in this data and graphing worksheet.
Worksheet
Coordinate Challenge: Treasure Hunt!
Worksheet
Coordinate Challenge: Treasure Hunt!
Sixth graders will mine four quadrants for gems in this data and graphing worksheet.
Sixth Grade
Data and Graphing
Worksheet
Mean Absolute Deviation
Worksheet
Mean Absolute Deviation
Sixth Grade
Data and Graphing
Students calculate the mean absolute deviation of data sets in this sixth-grade date and graphing worksheet.
Worksheet
Mean Absolute Deviation
Worksheet
Mean Absolute Deviation
Students calculate the mean absolute deviation of data sets in this sixth-grade date and graphing worksheet.
Sixth Grade
Data and Graphing
Worksheet
1
2
3
4
…
9