SKIP TO CONTENT
Worksheet Generator
Subjects
Grades
Worksheets
Games
Build a Worksheet
More Resources
Roly Recommends
Subjects
Grades
Worksheets
Games
Build a Worksheet
More Resources
Roly Recommends
All Subjects
Math
Data and Graphing
Subtopics:
Collecting and Organizing Data
Picture Graphs
Bar Graphs
Coordinate Plane
Show Less
Filters
Search for: colorful, ice, cube, experiment
✕
Math
✕
Subjects
Math
English Language Arts
Science
Social Studies
Foreign Language
Grade Level
Pre-K
K
1st
2nd
3rd
4th
5th
6th
7th
8th
Early Childhood
Elementary School
Middle School
Resource Type
Worksheets
Games
Lesson Plans
Interactive Worksheets
Activities
Offline Games
Occasion
Summer
Back to School
Common Core
Yes
Game Type
Ball Games
Arts & Crafts
Arts & Crafts
Paper & Glue Crafts
Construction & Sculpture
Recycled Crafts
English Language Support
Yes
See More
Clear All
View 81 results
Showing Results for colorful ice cube experiment : Page 3
81 results
Search for: colorful, ice, cube, experiment
✕
Math
✕
Sort by:
Relevance
Most recent
Most popular
Alphabetical A-Z
Alphabetical Z-A
All filters
81 results
Sort by:
Relevance
Most recent
Most popular
Alphabetical A-Z
Alphabetical Z-A
Make Predictions Using Experimental Probability
Interactive Worksheet
Make Predictions Using Experimental Probability
Seventh Grade
Data and Graphing
In this seventh-grade probability worksheet, students are introduced to the concept of experimental probability and shown how to use this information to make predictions.
Interactive Worksheet
Make Predictions Using Experimental Probability
Interactive Worksheet
Make Predictions Using Experimental Probability
In this seventh-grade probability worksheet, students are introduced to the concept of experimental probability and shown how to use this information to make predictions.
Seventh Grade
Data and Graphing
Interactive Worksheet
Probability Toss 3
Worksheet
Probability Toss 3
Fifth Grade
Data and Graphing
If your learner likes darts, then he'll love this probability worksheet! This dart board themed worksheet introduces your child to simple probability.
Worksheet
Probability Toss 3
Worksheet
Probability Toss 3
If your learner likes darts, then he'll love this probability worksheet! This dart board themed worksheet introduces your child to simple probability.
Fifth Grade
Data and Graphing
Worksheet
Why Do Leaves Change Color?
Activity
Why Do Leaves Change Color?
Second Grade
Data and Graphing
Engage your children with this fun fall activity that integrates math and science. First, your child will excavate to find leaves. Next, they'll examine them to determine the colors. Then, your child will graph their findings.
Activity
Why Do Leaves Change Color?
Activity
Why Do Leaves Change Color?
Engage your children with this fun fall activity that integrates math and science. First, your child will excavate to find leaves. Next, they'll examine them to determine the colors. Then, your child will graph their findings.
Second Grade
Data and Graphing
Activity
Simulate Compound Events #1
Worksheet
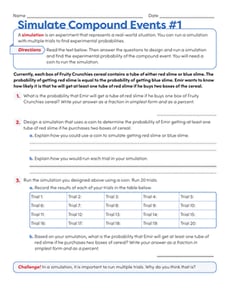
Simulate Compound Events #1
Seventh Grade
Data and Graphing
Practice designing a simulation for real-world compound events with this seventh-grade probability worksheet!
Worksheet
Simulate Compound Events #1
Worksheet
Simulate Compound Events #1
Practice designing a simulation for real-world compound events with this seventh-grade probability worksheet!
Seventh Grade
Data and Graphing
Worksheet
Coin Toss Probability
Worksheet
Coin Toss Probability
Fifth Grade
Data and Graphing
We all know a coin toss gives you a 50% chance of winning, but is it always that way? Delve into the inner-workings of coin toss probability with this activity.
Worksheet
Coin Toss Probability
Worksheet
Coin Toss Probability
We all know a coin toss gives you a 50% chance of winning, but is it always that way? Delve into the inner-workings of coin toss probability with this activity.
Fifth Grade
Data and Graphing
Worksheet
Reading Pictographs: Drink Your Milk!
Worksheet
Reading Pictographs: Drink Your Milk!
Third Grade
Data and Graphing
Can your child help Tommy figure out how much milk he drinks? As she does, she'll learn how to read and interpret data in graphs and practice multiplication.
Worksheet
Reading Pictographs: Drink Your Milk!
Worksheet
Reading Pictographs: Drink Your Milk!
Can your child help Tommy figure out how much milk he drinks? As she does, she'll learn how to read and interpret data in graphs and practice multiplication.
Third Grade
Data and Graphing
Worksheet
Favorite Cities Bar Graph
Worksheet
Favorite Cities Bar Graph
Second Grade
Data and Graphing
Can your second grader make her own bar chart? Use this pretend survey of 38 people and their favorite cities to find out!
Worksheet
Favorite Cities Bar Graph
Worksheet
Favorite Cities Bar Graph
Can your second grader make her own bar chart? Use this pretend survey of 38 people and their favorite cities to find out!
Second Grade
Data and Graphing
Worksheet
Practice Finding Range
Worksheet
Practice Finding Range
Sixth Grade
Data and Graphing
Give your students practice finding the range of a data set with this sixth-grade data and graphing worksheet!
Worksheet
Practice Finding Range
Worksheet
Practice Finding Range
Give your students practice finding the range of a data set with this sixth-grade data and graphing worksheet!
Sixth Grade
Data and Graphing
Worksheet
Preschool Math: Day and Night
Worksheet
Preschool Math: Day and Night
Pre-K
Data and Graphing
Help your preschooler wrap her head around nighttime and daytime objects with this cute categorization worksheet.
Worksheet
Preschool Math: Day and Night
Worksheet
Preschool Math: Day and Night
Help your preschooler wrap her head around nighttime and daytime objects with this cute categorization worksheet.
Pre-K
Data and Graphing
Worksheet
100th Day of School Scavenger Hunt
Activity
100th Day of School Scavenger Hunt
Pre-K
Numbers and Counting
Try a 100th Day of School Scavenger Hunt with your preschooler, and send her on the search for objects of different colors!
Activity
100th Day of School Scavenger Hunt
Activity
100th Day of School Scavenger Hunt
Try a 100th Day of School Scavenger Hunt with your preschooler, and send her on the search for objects of different colors!
Pre-K
Numbers and Counting
Activity
Picnic Bar Graph
Worksheet
Picnic Bar Graph
Second Grade
Data and Graphing
Which picnic games do you prefer? This bar graph shows some of the most popular picnic activities. Students will learn about analyzing data from a bar graph.
Worksheet
Picnic Bar Graph
Worksheet
Picnic Bar Graph
Which picnic games do you prefer? This bar graph shows some of the most popular picnic activities. Students will learn about analyzing data from a bar graph.
Second Grade
Data and Graphing
Worksheet
Make a Winter Weather Pictograph
Activity
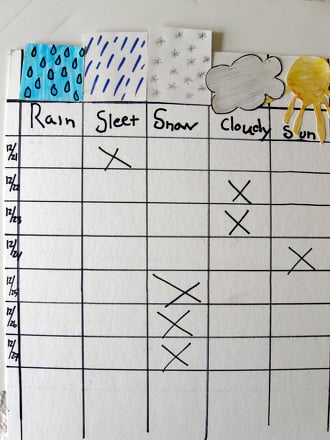
Make a Winter Weather Pictograph
First Grade
Data and Graphing
Encourage your kindergartener to investigate and chronicle the weather she observes during the coldest months of the year.
Activity
Make a Winter Weather Pictograph
Activity
Make a Winter Weather Pictograph
Encourage your kindergartener to investigate and chronicle the weather she observes during the coldest months of the year.
First Grade
Data and Graphing
Activity
Create a Rainbow of Healthy Food
Activity
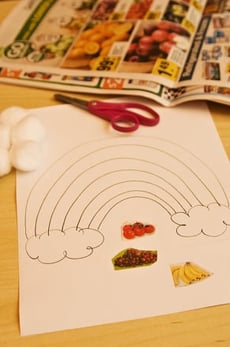
Create a Rainbow of Healthy Food
Pre-K
Data and Graphing
Help your preschooler chart her good eating habits with this arts and crafts activity that has her making a healthy fruits and vegetables rainbow and graph!
Activity
Create a Rainbow of Healthy Food
Activity
Create a Rainbow of Healthy Food
Help your preschooler chart her good eating habits with this arts and crafts activity that has her making a healthy fruits and vegetables rainbow and graph!
Pre-K
Data and Graphing
Activity
Count and Sort Fruit Salad
Activity
Count and Sort Fruit Salad
Pre-K
Numbers and Counting
In this fun snack-time activity, kids boost counting, sorting, and color recognition skills as they make a delicious and nutritious snack.
Activity
Count and Sort Fruit Salad
Activity
Count and Sort Fruit Salad
In this fun snack-time activity, kids boost counting, sorting, and color recognition skills as they make a delicious and nutritious snack.
Pre-K
Numbers and Counting
Activity
Game of Chance
Activity
Game of Chance
Third Grade
Data and Graphing
This fun math card game is a great opportunity to discuss probability with your third grader.
Activity
Game of Chance
Activity
Game of Chance
This fun math card game is a great opportunity to discuss probability with your third grader.
Third Grade
Data and Graphing
Activity
Clothespin Drop!
Activity
Clothespin Drop!
Pre-K
Numbers and Counting
Help your preschooler practice counting, matching, and learning colors with this fun game!
Activity
Clothespin Drop!
Activity
Clothespin Drop!
Help your preschooler practice counting, matching, and learning colors with this fun game!
Pre-K
Numbers and Counting
Activity
Create an Egg Carton Color Sorter
Activity
Create an Egg Carton Color Sorter
Pre-K
Data and Graphing
Teach your preschooler color recognition using this handy egg carton sorter. She will group objects by color and learn to recognize their names with this tool.
Activity
Create an Egg Carton Color Sorter
Activity
Create an Egg Carton Color Sorter
Teach your preschooler color recognition using this handy egg carton sorter. She will group objects by color and learn to recognize their names with this tool.
Pre-K
Data and Graphing
Activity
Make a THINGS I LIKE Poster!
Activity
Make a THINGS I LIKE Poster!
Pre-K
Data and Graphing
Put your junk mail to good use! Armed with a stack ads and a few simple art supplies, your preschooler can make a cool poster for his room.
Activity
Make a THINGS I LIKE Poster!
Activity
Make a THINGS I LIKE Poster!
Put your junk mail to good use! Armed with a stack ads and a few simple art supplies, your preschooler can make a cool poster for his room.
Pre-K
Data and Graphing
Activity
Math + Love = Valentine's Day Bar Graph
Lesson Plan
Math + Love = Valentine's Day Bar Graph
Second Grade
Data and Graphing
What's more romantic than a bar graph on Valentine's Day? In this Valentine's Day lesson plan, students will use information from a data set to create their own tally charts and bar graphs and then analyze these graphs to answer questions.
Lesson Plan
Math + Love = Valentine's Day Bar Graph
Lesson Plan
Math + Love = Valentine's Day Bar Graph
What's more romantic than a bar graph on Valentine's Day? In this Valentine's Day lesson plan, students will use information from a data set to create their own tally charts and bar graphs and then analyze these graphs to answer questions.
Second Grade
Data and Graphing
Lesson Plan
Track the Weather with Weather Charts
Activity
Track the Weather with Weather Charts
Third Grade
Measurement
Learn about the microclimate of your backyard by tracking rainfall, temperature, and observed weather with hand drawn charts and graphs.
Activity
Track the Weather with Weather Charts
Activity
Track the Weather with Weather Charts
Learn about the microclimate of your backyard by tracking rainfall, temperature, and observed weather with hand drawn charts and graphs.
Third Grade
Measurement
Activity
Graphing Colored Counters
Lesson Plan
Graphing Colored Counters
Kindergarten
Data and Graphing
In this lesson, your students will use the background knowledge that they have about counting and sorting to graph data. They will practice answering questions about the graph!
Lesson Plan
Graphing Colored Counters
Lesson Plan
Graphing Colored Counters
In this lesson, your students will use the background knowledge that they have about counting and sorting to graph data. They will practice answering questions about the graph!
Kindergarten
Data and Graphing
Lesson Plan
1
2
3