SKIP TO CONTENT
Worksheet Generator
Subjects
Grades
Worksheets
Games
Build a Worksheet
More Resources
Roly Recommends
Summer Boost
Subjects
Grades
Worksheets
Games
Build a Worksheet
More Resources
Roly Recommends
Summer Boost
Showing Results for logic problems : Page 3
Filters
Math
Data and Graphing
85 results
Search for: logic, problems
✕
Math
✕
Clear all
85 results
Subtopics:
Collecting and Organizing Data
Picture Graphs
Bar Graphs
Line Plots
Coordinate Plane
Box Plots
Histograms
Scatter Plots
Show Less
Filters
Search for: logic, problems
✕
Math
✕
Subjects
Math
English Language Arts
Science
Social Studies
Foreign Language
Technology
Grade Level
Pre-K
K
1st
2nd
3rd
4th
5th
6th
7th
8th
Early Childhood
Elementary School
Middle School
Resource Type
Worksheets
Games
Lesson Plans
Interactive Worksheets
Activities
Exercises
Occasion
Back to School
Valentine's Day
Common Core
Yes
English Language Support
Yes
Clear all
View 85 results
Showing Results for logic problems : Page 3
Filters
85 results
Search for: logic, problems
✕
Math
✕
Clear all
85 results
Drawing Inferences Using Data
Worksheet
Drawing Inferences Using Data
Seventh Grade
Data and Graphing
Students compare different survey methods to make inferences about how much time students at a school spend playing video games in this seventh-grade math worksheet.
Worksheet
Drawing Inferences Using Data
Worksheet
Drawing Inferences Using Data
Students compare different survey methods to make inferences about how much time students at a school spend playing video games in this seventh-grade math worksheet.
Seventh Grade
Data and Graphing
Worksheet
Sample Spaces of Compound Events
Worksheet
Sample Spaces of Compound Events
Seventh Grade
Data and Graphing
This seventh-grade math worksheet guides students through the process of finding the sample space of compound events.
Worksheet
Sample Spaces of Compound Events
Worksheet
Sample Spaces of Compound Events
This seventh-grade math worksheet guides students through the process of finding the sample space of compound events.
Seventh Grade
Data and Graphing
Worksheet
Estimating Lines of Best Fit
Worksheet
Estimating Lines of Best Fit
Eighth Grade
Data and Graphing
Students estimate and sketch lines of best fit on various scatter plots and describe the association displayed on each.
Worksheet
Estimating Lines of Best Fit
Worksheet
Estimating Lines of Best Fit
Students estimate and sketch lines of best fit on various scatter plots and describe the association displayed on each.
Eighth Grade
Data and Graphing
Worksheet
Graphing Proportional Relationships
Worksheet
Graphing Proportional Relationships
Eighth Grade
Ratios and Proportions
Practice graphing proportional relationships and finding the constant of proportionality with this eighth-grade math worksheet!
Worksheet
Graphing Proportional Relationships
Worksheet
Graphing Proportional Relationships
Practice graphing proportional relationships and finding the constant of proportionality with this eighth-grade math worksheet!
Eighth Grade
Ratios and Proportions
Worksheet
Graph Proportional Relationships #1
Worksheet
Graph Proportional Relationships #1
Eighth Grade
Ratios and Proportions
Help learners connect the constant of proportionality with the slope of a line in this one-page graphing worksheet!
Worksheet
Graph Proportional Relationships #1
Worksheet
Graph Proportional Relationships #1
Help learners connect the constant of proportionality with the slope of a line in this one-page graphing worksheet!
Eighth Grade
Ratios and Proportions
Worksheet
Interpreting Two-Way Frequency Tables
Worksheet
Interpreting Two-Way Frequency Tables
Eighth Grade
Data and Graphing
Students analyze two-way frequency tables in the context of relatable scenarios in this eighth-grade math worksheet!
Worksheet
Interpreting Two-Way Frequency Tables
Worksheet
Interpreting Two-Way Frequency Tables
Students analyze two-way frequency tables in the context of relatable scenarios in this eighth-grade math worksheet!
Eighth Grade
Data and Graphing
Worksheet
Solving Systems of Linear Equations By Graphing, Substitution, and Elimination Guided Notes
Worksheet
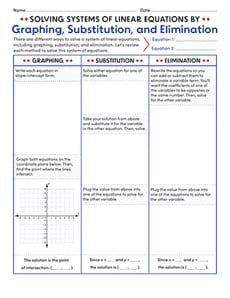
Solving Systems of Linear Equations By Graphing, Substitution, and Elimination Guided Notes
Eighth Grade
Algebra
Use these guided notes to give students confidence in solving systems of equations using graphing, substitution, and elimination methods!
Worksheet
Solving Systems of Linear Equations By Graphing, Substitution, and Elimination Guided Notes
Worksheet
Solving Systems of Linear Equations By Graphing, Substitution, and Elimination Guided Notes
Use these guided notes to give students confidence in solving systems of equations using graphing, substitution, and elimination methods!
Eighth Grade
Algebra
Worksheet
Pictographs: Say Cheese!
Worksheet
Pictographs: Say Cheese!
Third Grade
Data and Graphing
To keep track of his cheese sales, Giovanni uses a pictograph. Kids will figure out how his cheese business is doing by using data in the graph.
Worksheet
Pictographs: Say Cheese!
Worksheet
Pictographs: Say Cheese!
To keep track of his cheese sales, Giovanni uses a pictograph. Kids will figure out how his cheese business is doing by using data in the graph.
Third Grade
Data and Graphing
Worksheet
Winter Sports: Practice Reading a Bar Graph
Worksheet
Winter Sports: Practice Reading a Bar Graph
Second Grade
Data and Graphing
Children will practice interpreting a bar graph in this winter sports–themed math worksheet.
Worksheet
Winter Sports: Practice Reading a Bar Graph
Worksheet
Winter Sports: Practice Reading a Bar Graph
Children will practice interpreting a bar graph in this winter sports–themed math worksheet.
Second Grade
Data and Graphing
Worksheet
Find the Error: Distance Between Two Points
Worksheet
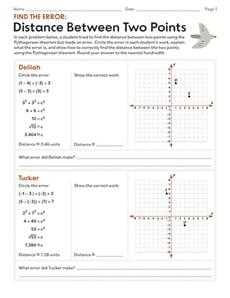
Find the Error: Distance Between Two Points
Eighth Grade
Geometry
Practice using the Pythagorean theorem to find the distance between points on a coordinate plane!
Worksheet
Find the Error: Distance Between Two Points
Worksheet
Find the Error: Distance Between Two Points
Practice using the Pythagorean theorem to find the distance between points on a coordinate plane!
Eighth Grade
Geometry
Worksheet
Find the Distance Between Two Points #2
Worksheet
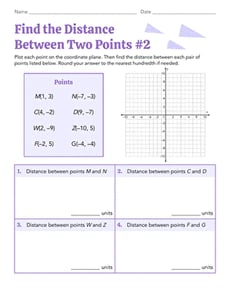
Find the Distance Between Two Points #2
Eighth Grade
Geometry
Test your geometry skills and use the Pythagorean theorem in this eighth-grade worksheet!
Worksheet
Find the Distance Between Two Points #2
Worksheet
Find the Distance Between Two Points #2
Test your geometry skills and use the Pythagorean theorem in this eighth-grade worksheet!
Eighth Grade
Geometry
Worksheet
Box Plots #2
Interactive Worksheet
Box Plots #2
Sixth Grade
Data and Graphing
Sixth graders will learn all about interpreting box plots in this helpful worksheet!
Interactive Worksheet
Box Plots #2
Interactive Worksheet
Box Plots #2
Sixth graders will learn all about interpreting box plots in this helpful worksheet!
Sixth Grade
Data and Graphing
Interactive Worksheet
Constructing Two-Way Relative Frequency Tables
Interactive Worksheet
Constructing Two-Way Relative Frequency Tables
Eighth Grade
Data and Graphing
Practice creating two-way relative frequency tables based on real-world scenarios with this eighth-grade math worksheet!
Interactive Worksheet
Constructing Two-Way Relative Frequency Tables
Interactive Worksheet
Constructing Two-Way Relative Frequency Tables
Practice creating two-way relative frequency tables based on real-world scenarios with this eighth-grade math worksheet!
Eighth Grade
Data and Graphing
Interactive Worksheet
Find the Distance Between Two Points #1
Worksheet
Find the Distance Between Two Points #1
Eighth Grade
Geometry
Practice the Pythagorean theorem with this eighth-grade geometry worksheet!
Worksheet
Find the Distance Between Two Points #1
Worksheet
Find the Distance Between Two Points #1
Practice the Pythagorean theorem with this eighth-grade geometry worksheet!
Eighth Grade
Geometry
Worksheet
Creating Histograms From Frequency Tables
Worksheet
Creating Histograms From Frequency Tables
Sixth Grade
Data and Graphing
Practice using histograms to show different sets of data in this engaging sixth-grade worksheet!
Worksheet
Creating Histograms From Frequency Tables
Worksheet
Creating Histograms From Frequency Tables
Practice using histograms to show different sets of data in this engaging sixth-grade worksheet!
Sixth Grade
Data and Graphing
Worksheet
From Dot Plots to Histograms
Worksheet
From Dot Plots to Histograms
Sixth Grade
Data and Graphing
Discover different ways to display data in this delightful sixth-grade worksheet!
Worksheet
From Dot Plots to Histograms
Worksheet
From Dot Plots to Histograms
Discover different ways to display data in this delightful sixth-grade worksheet!
Sixth Grade
Data and Graphing
Worksheet
Subtraction Action
Activity
Subtraction Action
Third Grade
Data and Graphing
Most parents probably wouldn't mind subtracting 8-9 years off their age. Here's a fun third grade subtraction activity that may do just that.
Activity
Subtraction Action
Activity
Subtraction Action
Most parents probably wouldn't mind subtracting 8-9 years off their age. Here's a fun third grade subtraction activity that may do just that.
Third Grade
Data and Graphing
Activity
Creating Box Plots
Worksheet
Creating Box Plots
Sixth Grade
Data and Graphing
Learn to draw your own box plots to show data in this informative sixth-grade worksheet!
Worksheet
Creating Box Plots
Worksheet
Creating Box Plots
Learn to draw your own box plots to show data in this informative sixth-grade worksheet!
Sixth Grade
Data and Graphing
Worksheet
Find the Distance Between Two Points #3
Worksheet
Find the Distance Between Two Points #3
Eighth Grade
Geometry
Challenge yourself to calculate the distance between pairs of points on a coordinate plane with this essential geometry worksheet!
Worksheet
Find the Distance Between Two Points #3
Worksheet
Find the Distance Between Two Points #3
Challenge yourself to calculate the distance between pairs of points on a coordinate plane with this essential geometry worksheet!
Eighth Grade
Geometry
Worksheet
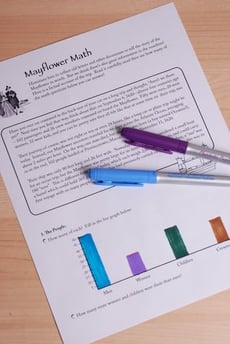
Mayflower Math
Activity
Mayflower Math
Fifth Grade
Data and Graphing
When you're studying the Mayflower, numbers can be an important part of the history...and a great chance to practice elementary math!
Activity
Mayflower Math
Activity
Mayflower Math
When you're studying the Mayflower, numbers can be an important part of the history...and a great chance to practice elementary math!
Fifth Grade
Data and Graphing
Activity
Dice Probability
Activity
Dice Probability
Fourth Grade
Data and Graphing
Analyze this simple betting game with your fourth grade student in order to discuss probability.
Activity
Dice Probability
Activity
Dice Probability
Analyze this simple betting game with your fourth grade student in order to discuss probability.
Fourth Grade
Data and Graphing
Activity
Olympic Math: Mean, Median and Mode Review
Lesson Plan
Olympic Math: Mean, Median and Mode Review
Fifth Grade
Data and Graphing
Help your students win gold with this lesson that gives them plenty of practice with mode, median, and mean.
Lesson Plan
Olympic Math: Mean, Median and Mode Review
Lesson Plan
Olympic Math: Mean, Median and Mode Review
Help your students win gold with this lesson that gives them plenty of practice with mode, median, and mean.
Fifth Grade
Data and Graphing
Lesson Plan
EL
Nature Counting
Lesson Plan
Nature Counting
Kindergarten
Data and Graphing
Use this fun lesson plan to introduce or review the concept of addition to your ELs. Can be used as a stand alone or support lesson for the
Nature and Counting It All Adds Up
lesson plan.
Lesson Plan
EL
Nature Counting
Lesson Plan
Nature Counting
Use this fun lesson plan to introduce or review the concept of addition to your ELs. Can be used as a stand alone or support lesson for the
Nature and Counting It All Adds Up
lesson plan.
Kindergarten
Data and Graphing
Lesson Plan
Mean, Median and Mode Madness!
Lesson Plan
Mean, Median and Mode Madness!
Third Grade
Data and Graphing
This lesson introduces students to the concepts of mean, median, and mode in a hands-on and visual way.
Lesson Plan
Mean, Median and Mode Madness!
Lesson Plan
Mean, Median and Mode Madness!
This lesson introduces students to the concepts of mean, median, and mode in a hands-on and visual way.
Third Grade
Data and Graphing
Lesson Plan
What is it Telling Me? Creating and Interpreting Line Plots
Lesson Plan
What is it Telling Me? Creating and Interpreting Line Plots
Third Grade
Data and Graphing
Line plots are a great way to introduce your students to graphing data. In this lesson, your students will learn how to create a line plot and also practice interpreting line plots.
Lesson Plan
What is it Telling Me? Creating and Interpreting Line Plots
Lesson Plan
What is it Telling Me? Creating and Interpreting Line Plots
Line plots are a great way to introduce your students to graphing data. In this lesson, your students will learn how to create a line plot and also practice interpreting line plots.
Third Grade
Data and Graphing
Lesson Plan
1
2
3