SKIP TO CONTENT
Worksheet Generator
Subjects
Grades
Worksheets
Games
Build a Worksheet
More Resources
Roly Recommends
Subjects
Grades
Worksheets
Games
Build a Worksheet
More Resources
Roly Recommends
Showing Results for students : Page 3
Filters
Math
Data and Graphing
203 results
Search for: students
✕
Math
✕
Clear all
203 results
Subtopics:
Collecting and Organizing Data
Picture Graphs
Bar Graphs
Line Plots
Coordinate Plane
Box Plots
Histograms
Scatter Plots
Show Less
Filters
Search for: students
✕
Math
✕
Subjects
Math
English Language Arts
Science
Social Studies
Foreign Language
Technology
Grade Level
Pre-K
K
1st
2nd
3rd
4th
5th
6th
7th
8th
Early Childhood
Elementary School
Middle School
Resource Type
Worksheets
Games
Lesson Plans
Interactive Worksheets
Activities
Exercises
Offline Games
Guided Lessons
Teacher Resources
Occasion
Birthdays
Summer
Back to School
Halloween
Holidays
Valentine's Day
Common Core
Yes
Game Type
Ball Games
Printable Board Games
English Language Support
Yes
Clear all
View 203 results
Showing Results for students : Page 3
Filters
203 results
Search for: students
✕
Math
✕
Clear all
203 results
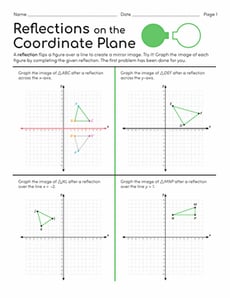
Reflections on the Coordinate Plane
Worksheet
Reflections on the Coordinate Plane
Eighth Grade
Geometry
This eighth-grade geometry worksheet gives students practice graphing images of figures after completing given reflections on coordinate planes.
Worksheet
Reflections on the Coordinate Plane
Worksheet
Reflections on the Coordinate Plane
This eighth-grade geometry worksheet gives students practice graphing images of figures after completing given reflections on coordinate planes.
Eighth Grade
Geometry
Worksheet
Interpreting Double Bar Graphs
Worksheet
Interpreting Double Bar Graphs
Fifth Grade
Data and Graphing
Students will cultivate the skills of reading, interpreting, and analyzing bar graphs with these questions that activate higher order thinking.
Worksheet
Interpreting Double Bar Graphs
Worksheet
Interpreting Double Bar Graphs
Students will cultivate the skills of reading, interpreting, and analyzing bar graphs with these questions that activate higher order thinking.
Fifth Grade
Data and Graphing
Worksheet
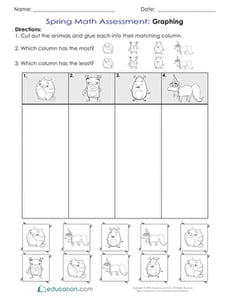
Spring Math Assessment: Graphing
Worksheet
Spring Math Assessment: Graphing
Kindergarten
Data and Graphing
It’s springtime in kindergarten! Use this worksheet to assess your students’ knowledge of sorting objects and using picture graphs.
Worksheet
Spring Math Assessment: Graphing
Worksheet
Spring Math Assessment: Graphing
It’s springtime in kindergarten! Use this worksheet to assess your students’ knowledge of sorting objects and using picture graphs.
Kindergarten
Data and Graphing
Worksheet
Probability and Statistics 3
Exercise
Probability and Statistics 3
Fifth Grade
Data and Graphing
After completing this third probability and statistics exercise, your students will seek out working on game theory on their own.
Exercise
Probability and Statistics 3
Exercise
Probability and Statistics 3
After completing this third probability and statistics exercise, your students will seek out working on game theory on their own.
Fifth Grade
Data and Graphing
Exercise
Probability and Statistics 2
Exercise
Probability and Statistics 2
Fourth Grade
Data and Graphing
Continue the probability and statistics fun with this involving exercise that shows students how to use data to make predictions.
Exercise
Probability and Statistics 2
Exercise
Probability and Statistics 2
Continue the probability and statistics fun with this involving exercise that shows students how to use data to make predictions.
Fourth Grade
Data and Graphing
Exercise
Pet Survey
Worksheet
Pet Survey
First Grade
Data and Graphing
Have your students survey one another about pet preferences using this interactive activity designed to practice representing and interpreting data.
Worksheet
Pet Survey
Worksheet
Pet Survey
Have your students survey one another about pet preferences using this interactive activity designed to practice representing and interpreting data.
First Grade
Data and Graphing
Worksheet
Collecting and Organizing Data 3
Exercise
Collecting and Organizing Data 3
Fifth Grade
Data and Graphing
By the time students complete this third exercise in the series, they will have become masters of collecting and organizing data.
Exercise
Collecting and Organizing Data 3
Exercise
Collecting and Organizing Data 3
By the time students complete this third exercise in the series, they will have become masters of collecting and organizing data.
Fifth Grade
Data and Graphing
Exercise
Scatter Plots
Worksheet
Scatter Plots
Eighth Grade
Data and Graphing
Students practice identifying outliers and the types of associations shown on scatter plots in this eighth-grade data and graphing worksheet!
Worksheet
Scatter Plots
Worksheet
Scatter Plots
Students practice identifying outliers and the types of associations shown on scatter plots in this eighth-grade data and graphing worksheet!
Eighth Grade
Data and Graphing
Worksheet
Make Predictions Using Theoretical Probability
Interactive Worksheet
Make Predictions Using Theoretical Probability
Seventh Grade
Data and Graphing
In this seventh-grade probability worksheet, students will practice finding the theoretical probabilities for different events and using those to make predictions.
Interactive Worksheet
Make Predictions Using Theoretical Probability
Interactive Worksheet
Make Predictions Using Theoretical Probability
In this seventh-grade probability worksheet, students will practice finding the theoretical probabilities for different events and using those to make predictions.
Seventh Grade
Data and Graphing
Interactive Worksheet
Interpreting Slopes and y-Intercepts of Lines of Best Fit
Worksheet
Interpreting Slopes and y-Intercepts of Lines of Best Fit
Eighth Grade
Algebra
Students interpret slopes and
y
-intercepts of lines of best fit based on real-world scenarios in this eighth-grade worksheet!
Worksheet
Interpreting Slopes and y-Intercepts of Lines of Best Fit
Worksheet
Interpreting Slopes and y-Intercepts of Lines of Best Fit
Students interpret slopes and
y
-intercepts of lines of best fit based on real-world scenarios in this eighth-grade worksheet!
Eighth Grade
Algebra
Worksheet
Histograms
Worksheet
Histograms
Sixth Grade
Data and Graphing
In this sixth-grade data and graphing worksheet, students will complete histograms from given data sets and frequency tables.
Worksheet
Histograms
Worksheet
Histograms
In this sixth-grade data and graphing worksheet, students will complete histograms from given data sets and frequency tables.
Sixth Grade
Data and Graphing
Worksheet
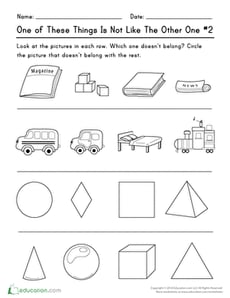
One of These Things Is Not Like The Other One (Part Two)
Worksheet
One of These Things Is Not Like The Other One (Part Two)
Kindergarten
Data and Graphing
Your students will have fun looking at the pictures in each row and deciding which item is not like the others.
Worksheet
One of These Things Is Not Like The Other One (Part Two)
Worksheet
One of These Things Is Not Like The Other One (Part Two)
Your students will have fun looking at the pictures in each row and deciding which item is not like the others.
Kindergarten
Data and Graphing
Worksheet
Let's Play Ball
Lesson Plan
Let's Play Ball
Third Grade
Multiplication
Students will have a ball with this data collection lesson plan where they learn about collecting and plotting data on a chart and line plot.
Lesson Plan
Let's Play Ball
Lesson Plan
Let's Play Ball
Students will have a ball with this data collection lesson plan where they learn about collecting and plotting data on a chart and line plot.
Third Grade
Multiplication
Lesson Plan
Bar Graphs: School Subjects
Worksheet
Bar Graphs: School Subjects
Second Grade
Data and Graphing
Math students, get ready to graph! Here is a great worksheet that will help your student practice making bar graphs from information provided.
Worksheet
Bar Graphs: School Subjects
Worksheet
Bar Graphs: School Subjects
Math students, get ready to graph! Here is a great worksheet that will help your student practice making bar graphs from information provided.
Second Grade
Data and Graphing
Worksheet
Eat Healthy Bar Graph
Worksheet
Eat Healthy Bar Graph
Third Grade
Data and Graphing
Use this relevant topic about healthy food to give your students practice reading a bar graph and answering questions about the data.
Worksheet
Eat Healthy Bar Graph
Worksheet
Eat Healthy Bar Graph
Use this relevant topic about healthy food to give your students practice reading a bar graph and answering questions about the data.
Third Grade
Data and Graphing
Worksheet
Experimental Probability
Worksheet
Experimental Probability
Seventh Grade
Data and Graphing
This seventh-grade math worksheet gives students a chance to find experimental probabilities using real-world scenarios in the form of word problems!
Worksheet
Experimental Probability
Worksheet
Experimental Probability
This seventh-grade math worksheet gives students a chance to find experimental probabilities using real-world scenarios in the form of word problems!
Seventh Grade
Data and Graphing
Worksheet
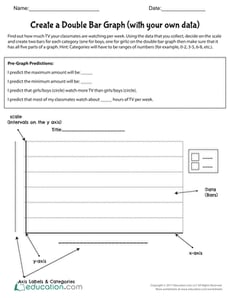
Create a Double Bar Graph (with your own data)
Worksheet
Create a Double Bar Graph (with your own data)
Fifth Grade
Data and Graphing
Students will collect data, create a double bar graph, and interpret the graph by responding to prompts that will get them thinking critically.
Worksheet
Create a Double Bar Graph (with your own data)
Worksheet
Create a Double Bar Graph (with your own data)
Students will collect data, create a double bar graph, and interpret the graph by responding to prompts that will get them thinking critically.
Fifth Grade
Data and Graphing
Worksheet
Ocean Lake River Questions
Worksheet
Ocean Lake River Questions
Second Grade
Data and Graphing
Do you prefer rivers, oceans, or lakes? Students will practice coming up with questions by analyzing the data given in this Venn diagram.
Worksheet
Ocean Lake River Questions
Worksheet
Ocean Lake River Questions
Do you prefer rivers, oceans, or lakes? Students will practice coming up with questions by analyzing the data given in this Venn diagram.
Second Grade
Data and Graphing
Worksheet
Box and Whisker Plot
Worksheet
Box and Whisker Plot
Sixth Grade
Data and Graphing
Students learn how to find the five-number summary and create a box and whisker plot for given data sets.
Worksheet
Box and Whisker Plot
Worksheet
Box and Whisker Plot
Students learn how to find the five-number summary and create a box and whisker plot for given data sets.
Sixth Grade
Data and Graphing
Worksheet
Practice Finding Range
Worksheet
Practice Finding Range
Sixth Grade
Data and Graphing
Give your students practice finding the range of a data set with this sixth-grade data and graphing worksheet!
Worksheet
Practice Finding Range
Worksheet
Practice Finding Range
Give your students practice finding the range of a data set with this sixth-grade data and graphing worksheet!
Sixth Grade
Data and Graphing
Worksheet
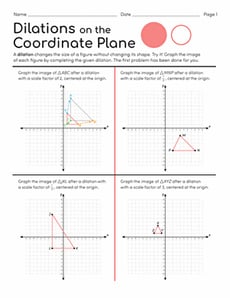
Dilations on the Coordinate Plane
Worksheet
Dilations on the Coordinate Plane
Eighth Grade
Geometry
In Dilations on the Coordinate Plane, students will practice graphing images of figures after completing given dilations, all of which are centered at the origin.
Worksheet
Dilations on the Coordinate Plane
Worksheet
Dilations on the Coordinate Plane
In Dilations on the Coordinate Plane, students will practice graphing images of figures after completing given dilations, all of which are centered at the origin.
Eighth Grade
Geometry
Worksheet
Graph My Design
Worksheet
Graph My Design
First Grade
Data and Graphing
Students build a design and then use this bar graph to show how many of each shape was used. Place inside a sheet protector to reuse.
Worksheet
Graph My Design
Worksheet
Graph My Design
Students build a design and then use this bar graph to show how many of each shape was used. Place inside a sheet protector to reuse.
First Grade
Data and Graphing
Worksheet
Lemonade Stand Pictograph
Worksheet
Lemonade Stand Pictograph
Second Grade
Data and Graphing
See how Susie's lemonade stand is doing! Students will learn how to analyze and compare data by answering questions based on the two pictographs.
Worksheet
Lemonade Stand Pictograph
Worksheet
Lemonade Stand Pictograph
See how Susie's lemonade stand is doing! Students will learn how to analyze and compare data by answering questions based on the two pictographs.
Second Grade
Data and Graphing
Worksheet
Graphing Colored Counters
Lesson Plan
Graphing Colored Counters
Kindergarten
Data and Graphing
In this lesson, your students will use the background knowledge that they have about counting and sorting to graph data. They will practice answering questions about the graph!
Lesson Plan
Graphing Colored Counters
Lesson Plan
Graphing Colored Counters
In this lesson, your students will use the background knowledge that they have about counting and sorting to graph data. They will practice answering questions about the graph!
Kindergarten
Data and Graphing
Lesson Plan
Make Predictions Using Experimental Probability
Interactive Worksheet
Make Predictions Using Experimental Probability
Seventh Grade
Data and Graphing
In this seventh-grade probability worksheet, students are introduced to the concept of experimental probability and shown how to use this information to make predictions.
Interactive Worksheet
Make Predictions Using Experimental Probability
Interactive Worksheet
Make Predictions Using Experimental Probability
In this seventh-grade probability worksheet, students are introduced to the concept of experimental probability and shown how to use this information to make predictions.
Seventh Grade
Data and Graphing
Interactive Worksheet
Creating Problem Questions for Line Plots
Worksheet
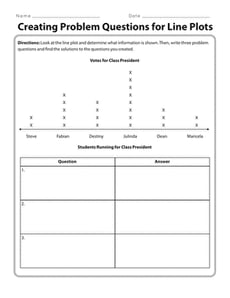
Creating Problem Questions for Line Plots
Third Grade
Data and Graphing
It’s time to flex your math muscles! Use this resource to have your students look at a line plot and create questions.
Worksheet
Creating Problem Questions for Line Plots
Worksheet
Creating Problem Questions for Line Plots
It’s time to flex your math muscles! Use this resource to have your students look at a line plot and create questions.
Third Grade
Data and Graphing
Worksheet
Graphing Favorite Pets
Worksheet
Graphing Favorite Pets
First Grade
Data and Graphing
Mix up math lessons with this pet-inspired graphing exercise. This is an interactive way to teach your students how to collect data and graph their findings.
Worksheet
Graphing Favorite Pets
Worksheet
Graphing Favorite Pets
Mix up math lessons with this pet-inspired graphing exercise. This is an interactive way to teach your students how to collect data and graph their findings.
First Grade
Data and Graphing
Worksheet
Comparing Sets of Data
Worksheet
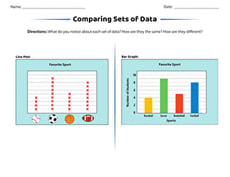
Comparing Sets of Data
Second Grade
Data and Graphing
Want to help your students begin to think critically about data? Laminate and display this worksheet to spark discussion about different ways to represent data.
Worksheet
Comparing Sets of Data
Worksheet
Comparing Sets of Data
Want to help your students begin to think critically about data? Laminate and display this worksheet to spark discussion about different ways to represent data.
Second Grade
Data and Graphing
Worksheet
Coordinate Plane Shapes
Worksheet
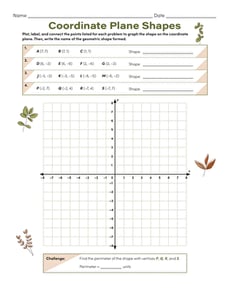
Coordinate Plane Shapes
Sixth Grade
Data and Graphing
Give your students practice drawing polygons on the coordinate plane using given coordinates for the vertices with this sixth-grade geometry worksheet!
Worksheet
Coordinate Plane Shapes
Worksheet
Coordinate Plane Shapes
Give your students practice drawing polygons on the coordinate plane using given coordinates for the vertices with this sixth-grade geometry worksheet!
Sixth Grade
Data and Graphing
Worksheet
Write Problem Questions for Line Plots
Worksheet
Write Problem Questions for Line Plots
Third Grade
Data and Graphing
Give your students the opportunity to think critically as a mathematician. In this exercise, they will analyze a line plot and create questions about the data.
Worksheet
Write Problem Questions for Line Plots
Worksheet
Write Problem Questions for Line Plots
Give your students the opportunity to think critically as a mathematician. In this exercise, they will analyze a line plot and create questions about the data.
Third Grade
Data and Graphing
Worksheet
1
2
3
4
…
7