SKIP TO CONTENT
Worksheet Generator
Subjects
Grades
Worksheets
Games
Build a Worksheet
More Resources
Roly Recommends
Summer Boost
Subjects
Grades
Worksheets
Games
Build a Worksheet
More Resources
Roly Recommends
Summer Boost
Showing Results for prompt
Filters
Math
Data and Graphing
8 results
Search for: prompt
✕
Math
✕
Clear all
8 results
Subtopics:
Collecting and Organizing Data
Bar Graphs
Line Plots
Show Less
Filters
Search for: prompt
✕
Math
✕
Subjects
Math
English Language Arts
Science
Social Studies
Foreign Language
Technology
Grade Level
Pre-K
K
1st
2nd
3rd
4th
5th
6th
7th
8th
Early Childhood
Elementary School
Middle School
Resource Type
Worksheets
Lesson Plans
Common Core
Yes
English Language Support
Yes
Clear all
View 8 results
Showing Results for prompt
Filters
8 results
Search for: prompt
✕
Math
✕
Clear all
8 results
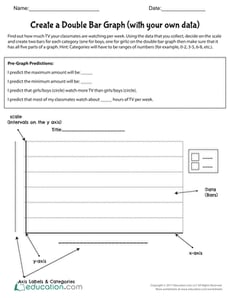
Create a Double Bar Graph (with your own data)
Worksheet
Create a Double Bar Graph (with your own data)
Fifth Grade
Data and Graphing
Students will collect data, create a double bar graph, and interpret the graph by responding to prompts that will get them thinking critically.
Worksheet
Create a Double Bar Graph (with your own data)
Worksheet
Create a Double Bar Graph (with your own data)
Students will collect data, create a double bar graph, and interpret the graph by responding to prompts that will get them thinking critically.
Fifth Grade
Data and Graphing
Worksheet
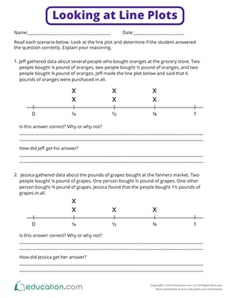
Looking at Line Plots
Worksheet
Looking at Line Plots
Fifth Grade
Fractions
This worksheet prompts students' critical thinking skills. Students will need to determine if several line plot problems are solved correctly and explain their reasoning.
Worksheet
Looking at Line Plots
Worksheet
Looking at Line Plots
This worksheet prompts students' critical thinking skills. Students will need to determine if several line plot problems are solved correctly and explain their reasoning.
Fifth Grade
Fractions
Worksheet
Create a Line Plot with Data Provided
Worksheet
Create a Line Plot with Data Provided
Third Grade
Data and Graphing
Use the data provided to have your students create a line plot that reflects how much TV watched per week for one third grade class.
Worksheet
Create a Line Plot with Data Provided
Worksheet
Create a Line Plot with Data Provided
Use the data provided to have your students create a line plot that reflects how much TV watched per week for one third grade class.
Third Grade
Data and Graphing
Worksheet
Making a Graph: Andy's Safari
Worksheet
Making a Graph: Andy's Safari
Second Grade
Data and Graphing
Give your second grader a fun way to practice reading and using graphs, as well as practice basic arithmetic with this graphing worksheet.
Worksheet
Making a Graph: Andy's Safari
Worksheet
Making a Graph: Andy's Safari
Give your second grader a fun way to practice reading and using graphs, as well as practice basic arithmetic with this graphing worksheet.
Second Grade
Data and Graphing
Worksheet
Graphing Colored Counters
Lesson Plan
Graphing Colored Counters
Kindergarten
Data and Graphing
In this lesson, your students will use the background knowledge that they have about counting and sorting to graph data. They will practice answering questions about the graph!
Lesson Plan
Graphing Colored Counters
Lesson Plan
Graphing Colored Counters
In this lesson, your students will use the background knowledge that they have about counting and sorting to graph data. They will practice answering questions about the graph!
Kindergarten
Data and Graphing
Lesson Plan
EL
Graph My Design
Lesson Plan
Graph My Design
First Grade
Geometry
Geometry meets data in this fun lesson! Students will build a design using pattern blocks and then graph the number of each shape used. This scaffolded EL lesson can be used alone or alongside
Graphing Colored Counters.
Lesson Plan
EL
Graph My Design
Lesson Plan
Graph My Design
Geometry meets data in this fun lesson! Students will build a design using pattern blocks and then graph the number of each shape used. This scaffolded EL lesson can be used alone or alongside
Graphing Colored Counters.
First Grade
Geometry
Lesson Plan
Math + Love = Valentine's Day Bar Graph
Lesson Plan
Math + Love = Valentine's Day Bar Graph
Second Grade
Data and Graphing
What's more romantic than a bar graph on Valentine's Day? In this Valentine's Day lesson plan, students will use information from a data set to create their own tally charts and bar graphs and then analyze these graphs to answer questions.
Lesson Plan
Math + Love = Valentine's Day Bar Graph
Lesson Plan
Math + Love = Valentine's Day Bar Graph
What's more romantic than a bar graph on Valentine's Day? In this Valentine's Day lesson plan, students will use information from a data set to create their own tally charts and bar graphs and then analyze these graphs to answer questions.
Second Grade
Data and Graphing
Lesson Plan
What is it Telling Me? Creating and Interpreting Line Plots
Lesson Plan
What is it Telling Me? Creating and Interpreting Line Plots
Third Grade
Data and Graphing
Line plots are a great way to introduce your students to graphing data. In this lesson, your students will learn how to create a line plot and also practice interpreting line plots.
Lesson Plan
What is it Telling Me? Creating and Interpreting Line Plots
Lesson Plan
What is it Telling Me? Creating and Interpreting Line Plots
Line plots are a great way to introduce your students to graphing data. In this lesson, your students will learn how to create a line plot and also practice interpreting line plots.
Third Grade
Data and Graphing
Lesson Plan
1