SKIP TO CONTENT
Worksheet Generator
Subjects
Grades
Worksheets
Games
Build a Worksheet
More Resources
Roly Recommends
Subjects
Grades
Worksheets
Games
Build a Worksheet
More Resources
Roly Recommends
Data and Graphing Resources for 'weather cloud types'
Filters
Math
Data and Graphing
28 results
Search for: weather, cloud, types
✕
Math
✕
Clear all
28 results
Subtopics:
Collecting and Organizing Data
Picture Graphs
Bar Graphs
Line Plots
Coordinate Plane
Box Plots
Histograms
Scatter Plots
Show Less
Filters
Search for: weather, cloud, types
✕
Math
✕
Subjects
Math
English Language Arts
Science
Social Studies
Foreign Language
Technology
Grade Level
Pre-K
K
1st
2nd
3rd
4th
5th
6th
7th
8th
Early Childhood
Elementary School
Middle School
Resource Type
Worksheets
Games
Lesson Plans
Interactive Worksheets
Activities
Offline Games
Occasion
Hanukkah
Holidays
Valentine's Day
Winter
Common Core
Yes
Game Type
Ball Games
Arts & Crafts
Arts & Crafts
Paper & Glue Crafts
Painting & Drawing
Clear all
View 28 results
Data and Graphing Resources for 'weather cloud types'
Filters
28 results
Search for: weather, cloud, types
✕
Math
✕
Clear all
28 results
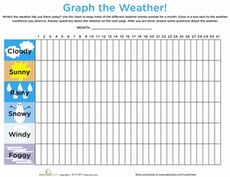
Weather Graph
Worksheet
Weather Graph
First Grade
Data and Graphing
Observe and record the weather with your kindergartener with this cute fill-in weather graph.
Worksheet
Weather Graph
Worksheet
Weather Graph
Observe and record the weather with your kindergartener with this cute fill-in weather graph.
First Grade
Data and Graphing
Worksheet
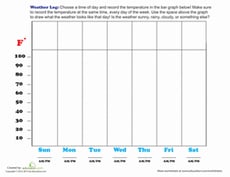
Weather Log
Worksheet
Weather Log
First Grade
Measurement
Rain or shine, get ready for some weather watching! Record data to observe the weather patterns over the course of a week.
Worksheet
Weather Log
Worksheet
Weather Log
Rain or shine, get ready for some weather watching! Record data to observe the weather patterns over the course of a week.
First Grade
Measurement
Worksheet
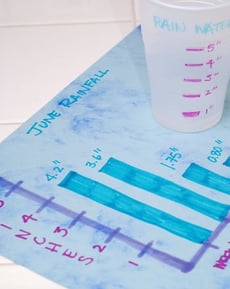
Track the Weather with Weather Charts
Activity
Track the Weather with Weather Charts
Third Grade
Measurement
Learn about the microclimate of your backyard by tracking rainfall, temperature, and observed weather with hand drawn charts and graphs.
Activity
Track the Weather with Weather Charts
Activity
Track the Weather with Weather Charts
Learn about the microclimate of your backyard by tracking rainfall, temperature, and observed weather with hand drawn charts and graphs.
Third Grade
Measurement
Activity
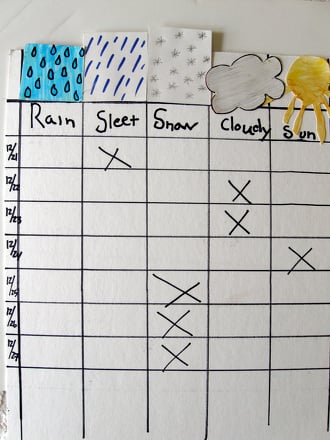
Make a Winter Weather Pictograph
Activity
Make a Winter Weather Pictograph
First Grade
Data and Graphing
Encourage your kindergartener to investigate and chronicle the weather she observes during the coldest months of the year.
Activity
Make a Winter Weather Pictograph
Activity
Make a Winter Weather Pictograph
Encourage your kindergartener to investigate and chronicle the weather she observes during the coldest months of the year.
First Grade
Data and Graphing
Activity
Different Types of Graphs: Picture and Bar Graphs
Worksheet
Different Types of Graphs: Picture and Bar Graphs
First Grade
Data and Graphing
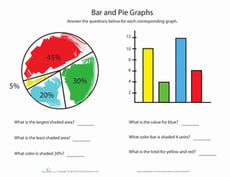
Sure to test your kid's graphing skills, this graph worksheet features two different types of graphs and questions to go along with them.
Worksheet
Different Types of Graphs: Picture and Bar Graphs
Worksheet
Different Types of Graphs: Picture and Bar Graphs
Sure to test your kid's graphing skills, this graph worksheet features two different types of graphs and questions to go along with them.
First Grade
Data and Graphing
Worksheet
Scatter Plots
Worksheet
Scatter Plots
Eighth Grade
Data and Graphing
Students practice identifying outliers and the types of associations shown on scatter plots in this eighth-grade data and graphing worksheet!
Worksheet
Scatter Plots
Worksheet
Scatter Plots
Students practice identifying outliers and the types of associations shown on scatter plots in this eighth-grade data and graphing worksheet!
Eighth Grade
Data and Graphing
Worksheet
Valentine's Venn Diagram
Activity
Valentine's Venn Diagram
Kindergarten
Data and Graphing
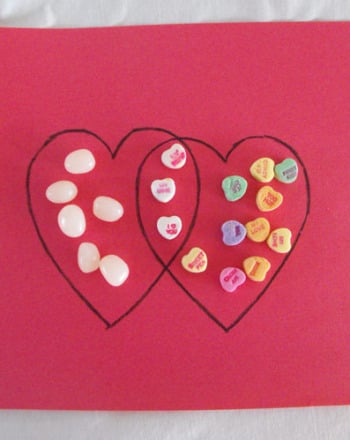
In this simple math activity, your young learner will compare two types of Valentine's Day candy using a Venn diagram.
Activity
Valentine's Venn Diagram
Activity
Valentine's Venn Diagram
In this simple math activity, your young learner will compare two types of Valentine's Day candy using a Venn diagram.
Kindergarten
Data and Graphing
Activity
Probability Toss 4
Worksheet
Probability Toss 4
Fifth Grade
Data and Graphing
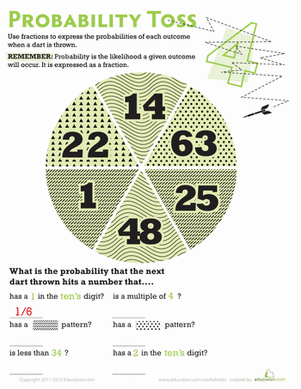
Help your child learn about probability with a dart board math worksheet. Use math skills to calculate the probability of a dart hitting number types.
Worksheet
Probability Toss 4
Worksheet
Probability Toss 4
Help your child learn about probability with a dart board math worksheet. Use math skills to calculate the probability of a dart hitting number types.
Fifth Grade
Data and Graphing
Worksheet
Winter Temperatures
Worksheet
Winter Temperatures
Fourth Grade
Measurement
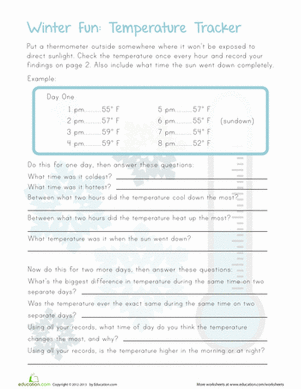
Your meteorologist in the making will investigate changes in temperature as she practices charting and graphing data.
Worksheet
Winter Temperatures
Worksheet
Winter Temperatures
Your meteorologist in the making will investigate changes in temperature as she practices charting and graphing data.
Fourth Grade
Measurement
Worksheet
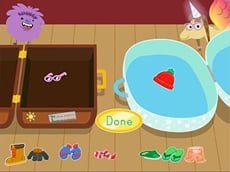
Seasons Suitcase Sort
Game
Seasons Suitcase Sort
Kindergarten
Data and Graphing
Kids sort winter and summer clothes in this cute categorization game.
Game
Seasons Suitcase Sort
Game
Seasons Suitcase Sort
Kids sort winter and summer clothes in this cute categorization game.
Kindergarten
Data and Graphing
Game
Beach Girl Paper Doll
Worksheet
Beach Girl Paper Doll
Pre-K
Data and Graphing
What would you wear if you were going to the beach? Have some fun with this sunny worksheet all about the seasons.
Worksheet
Beach Girl Paper Doll
Worksheet
Beach Girl Paper Doll
What would you wear if you were going to the beach? Have some fun with this sunny worksheet all about the seasons.
Pre-K
Data and Graphing
Worksheet
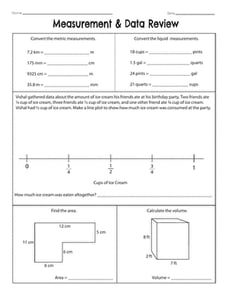
Measurement & Data Review
Worksheet
Measurement & Data Review
Fifth Grade
Fractions
Assess your students’ knowledge of fifth grade data and measurement concepts.
Worksheet
Measurement & Data Review
Worksheet
Measurement & Data Review
Assess your students’ knowledge of fifth grade data and measurement concepts.
Fifth Grade
Fractions
Worksheet
Make a Temperature Tracker
Activity
Make a Temperature Tracker
Fifth Grade
Geometry
Here's a fun at-home activity that will help your child strengthen math skills using high and low temperature data, and become a master temperature tracker!
Activity
Make a Temperature Tracker
Activity
Make a Temperature Tracker
Here's a fun at-home activity that will help your child strengthen math skills using high and low temperature data, and become a master temperature tracker!
Fifth Grade
Geometry
Activity
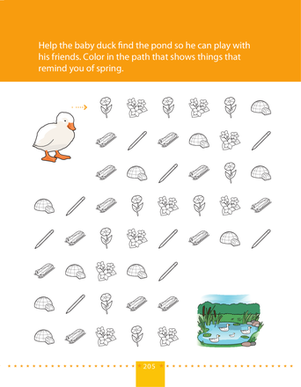
Color the Spring Things Path
Worksheet
Color the Spring Things Path
Pre-K
Data and Graphing
A duck wants to get to the pond! On this prekindergarten math and science worksheet, kids follow a pattern of spring things to help the duck get to the pond.
Worksheet
Color the Spring Things Path
Worksheet
Color the Spring Things Path
A duck wants to get to the pond! On this prekindergarten math and science worksheet, kids follow a pattern of spring things to help the duck get to the pond.
Pre-K
Data and Graphing
Worksheet
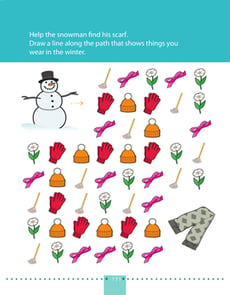
Follow the Winter Clothes Path
Worksheet
Follow the Winter Clothes Path
Pre-K
Data and Graphing
A snowman needs his scarf! On this prekindergarten math and science worksheet, kids follow a pattern of winter clothes to get the snowman to his scarf.
Worksheet
Follow the Winter Clothes Path
Worksheet
Follow the Winter Clothes Path
A snowman needs his scarf! On this prekindergarten math and science worksheet, kids follow a pattern of winter clothes to get the snowman to his scarf.
Pre-K
Data and Graphing
Worksheet
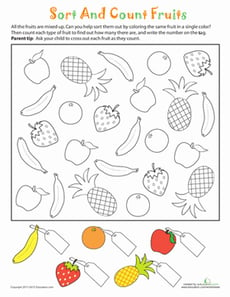
Sort and Count Fruits
Worksheet
Sort and Count Fruits
Kindergarten
Numbers and Counting
How many different kinds of fruit do you see? Help your child learn to sort and count objects with a fun coloring activity.
Worksheet
Sort and Count Fruits
Worksheet
Sort and Count Fruits
How many different kinds of fruit do you see? Help your child learn to sort and count objects with a fun coloring activity.
Kindergarten
Numbers and Counting
Worksheet
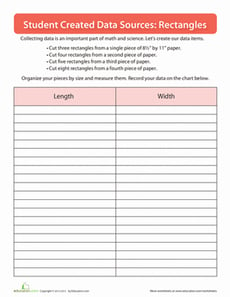
Creating Data
Worksheet
Creating Data
Third Grade
Measurement
Practice creating your own data sources in this introductory graphing activity.
Worksheet
Creating Data
Worksheet
Creating Data
Practice creating your own data sources in this introductory graphing activity.
Third Grade
Measurement
Worksheet
Bounce that Ball: Learn Math While Doing Sports
Activity
Bounce that Ball: Learn Math While Doing Sports
First Grade
Data and Graphing
Head out to the driveway, ball in hand, for a bouncing challenge. Then use those results to make a colorful graph that lets your child compare results.
Activity
Bounce that Ball: Learn Math While Doing Sports
Activity
Bounce that Ball: Learn Math While Doing Sports
Head out to the driveway, ball in hand, for a bouncing challenge. Then use those results to make a colorful graph that lets your child compare results.
First Grade
Data and Graphing
Activity
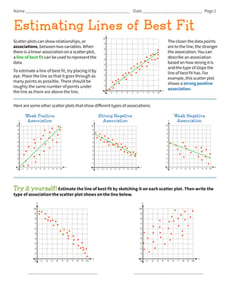
Estimating Lines of Best Fit
Worksheet
Estimating Lines of Best Fit
Eighth Grade
Data and Graphing
Students estimate and sketch lines of best fit on various scatter plots and describe the association displayed on each.
Worksheet
Estimating Lines of Best Fit
Worksheet
Estimating Lines of Best Fit
Students estimate and sketch lines of best fit on various scatter plots and describe the association displayed on each.
Eighth Grade
Data and Graphing
Worksheet
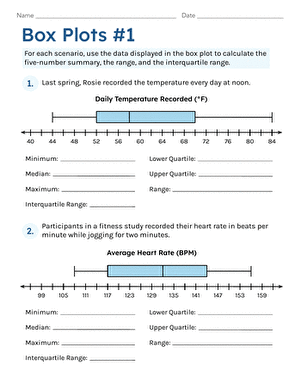
Box Plots #1
Interactive Worksheet
Box Plots #1
Sixth Grade
Data and Graphing
Practice interpreting box plots with this sixth-grade worksheet!
Interactive Worksheet
Box Plots #1
Interactive Worksheet
Box Plots #1
Practice interpreting box plots with this sixth-grade worksheet!
Sixth Grade
Data and Graphing
Interactive Worksheet
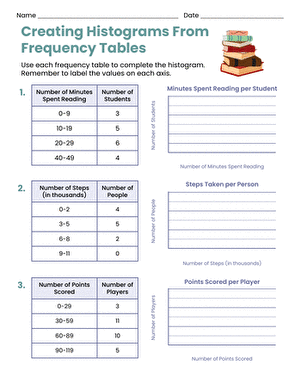
Creating Histograms From Frequency Tables
Worksheet
Creating Histograms From Frequency Tables
Sixth Grade
Data and Graphing
Practice using histograms to show different sets of data in this engaging sixth-grade worksheet!
Worksheet
Creating Histograms From Frequency Tables
Worksheet
Creating Histograms From Frequency Tables
Practice using histograms to show different sets of data in this engaging sixth-grade worksheet!
Sixth Grade
Data and Graphing
Worksheet
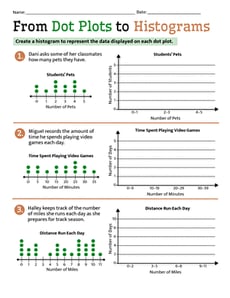
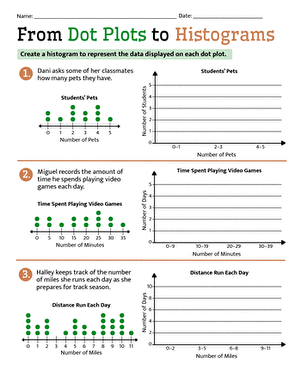
From Dot Plots to Histograms
Worksheet
From Dot Plots to Histograms
Sixth Grade
Data and Graphing
Discover different ways to display data in this delightful sixth-grade worksheet!
Worksheet
From Dot Plots to Histograms
Worksheet
From Dot Plots to Histograms
Discover different ways to display data in this delightful sixth-grade worksheet!
Sixth Grade
Data and Graphing
Worksheet
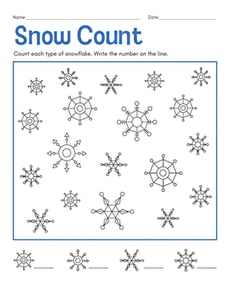
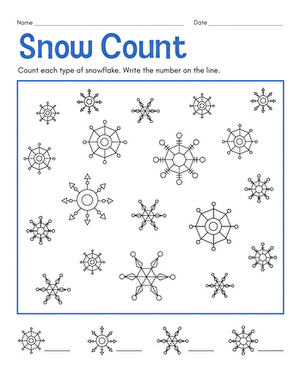
Snow Fun
Worksheet
Snow Fun
First Grade
Numbers and Counting
Find out whether snowflakes are
really
unique in this counting worksheet that's
snow much fun
!
Worksheet
Snow Fun
Worksheet
Snow Fun
Find out whether snowflakes are
really
unique in this counting worksheet that's
snow much fun
!
First Grade
Numbers and Counting
Worksheet
Why Do Leaves Change Color?
Activity
Why Do Leaves Change Color?
Second Grade
Data and Graphing
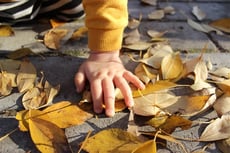
Engage your children with this fun fall activity that integrates math and science. First, your child will excavate to find leaves. Next, they'll examine them to determine the colors. Then, your child will graph their findings.
Activity
Why Do Leaves Change Color?
Activity
Why Do Leaves Change Color?
Engage your children with this fun fall activity that integrates math and science. First, your child will excavate to find leaves. Next, they'll examine them to determine the colors. Then, your child will graph their findings.
Second Grade
Data and Graphing
Activity
Make a Menorah Light Chart
Activity
Make a Menorah Light Chart
Second Grade
Data and Graphing
Your child can brush up on her math skills by charting the length of time that each candle on the menorah takes to burn.
Activity
Make a Menorah Light Chart
Activity
Make a Menorah Light Chart
Your child can brush up on her math skills by charting the length of time that each candle on the menorah takes to burn.
Second Grade
Data and Graphing
Activity
Backyard Bugs
Activity
Backyard Bugs
First Grade
Data and Graphing
Want to boost math and science learning? Take a bug expedition and give your first grader practice observing and charting what they see.
Activity
Backyard Bugs
Activity
Backyard Bugs
Want to boost math and science learning? Take a bug expedition and give your first grader practice observing and charting what they see.
First Grade
Data and Graphing
Activity
Study of Names
Activity
Study of Names
Third Grade
Data and Graphing
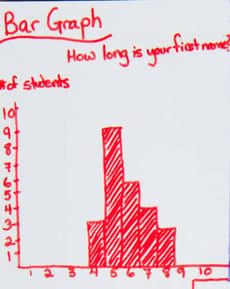
Graph are a great way to organize information. Your child will get to practice graphing by creating a bar graph and a pictorial graph of her friend's names.
Activity
Study of Names
Activity
Study of Names
Graph are a great way to organize information. Your child will get to practice graphing by creating a bar graph and a pictorial graph of her friend's names.
Third Grade
Data and Graphing
Activity
Math + Love = Valentine's Day Bar Graph
Lesson Plan
Math + Love = Valentine's Day Bar Graph
Second Grade
Data and Graphing
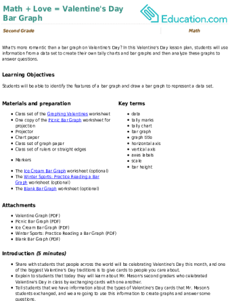
What's more romantic than a bar graph on Valentine's Day? In this Valentine's Day lesson plan, students will use information from a data set to create their own tally charts and bar graphs and then analyze these graphs to answer questions.
Lesson Plan
Math + Love = Valentine's Day Bar Graph
Lesson Plan
Math + Love = Valentine's Day Bar Graph
What's more romantic than a bar graph on Valentine's Day? In this Valentine's Day lesson plan, students will use information from a data set to create their own tally charts and bar graphs and then analyze these graphs to answer questions.
Second Grade
Data and Graphing
Lesson Plan
1