SKIP TO CONTENT
Worksheet Generator
Subjects
Grades
Worksheets
Games
Build a Worksheet
More Resources
Roly Recommends
Summer Boost
Subjects
Grades
Worksheets
Games
Build a Worksheet
More Resources
Roly Recommends
Summer Boost
Showing Results for and on : Page 3
Filters
Math
Data and Graphing
83 results
Search for: and, on
✕
Math
✕
Clear all
83 results
Subtopics:
Collecting and Organizing Data
Picture Graphs
✕
Bar Graphs
Line Plots
Coordinate Plane
Box Plots
Histograms
Scatter Plots
Show Less
Filters
Search for: and, on
✕
Math
✕
Subjects
Math
English Language Arts
Science
Social Studies
Foreign Language
Technology
Grade Level
Pre-K
K
1st
2nd
3rd
4th
5th
6th
7th
8th
Early Childhood
Elementary School
Middle School
Resource Type
Worksheets
Games
Interactive Worksheets
Workbooks
Activities
Offline Games
Guided Lessons
Occasion
Summer
Common Core
Yes
Game Type
Ball Games
Clear all
View 83 results
Showing Results for and on : Page 3
Filters
83 results
Search for: and, on
✕
Math
✕
Clear all
83 results
Ice Cream Graph #13
Worksheet
Ice Cream Graph #13
First Grade
Data and Graphing
Practice graphing data with Sam, Kate and Becky as they sell ice cream cones! Your child will keep track of their sales by putting the data into a pictograph.
Worksheet
Ice Cream Graph #13
Worksheet
Ice Cream Graph #13
Practice graphing data with Sam, Kate and Becky as they sell ice cream cones! Your child will keep track of their sales by putting the data into a pictograph.
First Grade
Data and Graphing
Worksheet
Data 1
Guided Lesson
Data 1
Third Grade
Fractions
Learning how to represent numerical information is a key part of the third grade math curriculum. This lesson in data provides guided instruction designed by our team of curriculum experts and teachers to present this concept in an engaging way. Not only that, but helpful exercises help kids to see the practical applicaton of these skills in the real world.
Guided Lesson
Data 1
Guided Lesson
Data 1
Learning how to represent numerical information is a key part of the third grade math curriculum. This lesson in data provides guided instruction designed by our team of curriculum experts and teachers to present this concept in an engaging way. Not only that, but helpful exercises help kids to see the practical applicaton of these skills in the real world.
Third Grade
Fractions
Guided Lesson
Make a Venn Diagram: Gift Boxes
Worksheet
Make a Venn Diagram: Gift Boxes
Second Grade
Data and Graphing
Kids practice making a Venn diagram about kinds of gift wrap by sorting the gifts in their correct spaces in this 2nd grade math worksheet.
Worksheet
Make a Venn Diagram: Gift Boxes
Worksheet
Make a Venn Diagram: Gift Boxes
Kids practice making a Venn diagram about kinds of gift wrap by sorting the gifts in their correct spaces in this 2nd grade math worksheet.
Second Grade
Data and Graphing
Worksheet
Make a Family Fridge Graph
Activity
Make a Family Fridge Graph
First Grade
Data and Graphing
Make a fun refrigerator graph with your first grader in order to help her develop those crucial graphing skills, while engaging with the whole family.
Activity
Make a Family Fridge Graph
Activity
Make a Family Fridge Graph
Make a fun refrigerator graph with your first grader in order to help her develop those crucial graphing skills, while engaging with the whole family.
First Grade
Data and Graphing
Activity
Reading a Bar Graph: Number of Athletes
Worksheet
Reading a Bar Graph: Number of Athletes
Third Grade
Data and Graphing
In this sports-themed worksheet, children use a bar graph to answer six questions about the number of athletes playing at a time in a variety of sporting events.
Worksheet
Reading a Bar Graph: Number of Athletes
Worksheet
Reading a Bar Graph: Number of Athletes
In this sports-themed worksheet, children use a bar graph to answer six questions about the number of athletes playing at a time in a variety of sporting events.
Third Grade
Data and Graphing
Worksheet
Make a Picture Graph
Worksheet
Make a Picture Graph
First Grade
Data and Graphing
In this math worksheet, children use picture graphs to tally up the total amounts of baked goods each party purchases.
Worksheet
Make a Picture Graph
Worksheet
Make a Picture Graph
In this math worksheet, children use picture graphs to tally up the total amounts of baked goods each party purchases.
First Grade
Data and Graphing
Worksheet
Pool Toys Venn Diagram
Worksheet
Pool Toys Venn Diagram
Second Grade
Data and Graphing
Students practice creating a Venn diagram by organizing the pool toys into the correct categories. Students will also learn to differentiate between shapes.
Worksheet
Pool Toys Venn Diagram
Worksheet
Pool Toys Venn Diagram
Students practice creating a Venn diagram by organizing the pool toys into the correct categories. Students will also learn to differentiate between shapes.
Second Grade
Data and Graphing
Worksheet
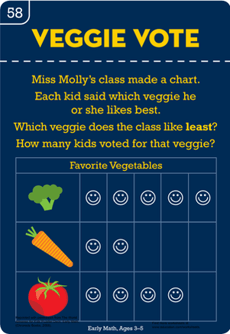
Veggie Vote: Practicing Counting
Worksheet
Veggie Vote: Practicing Counting
Kindergarten
Data and Graphing
In this worksheet your preschooler will count tally marks to determine which vegetable was the most popular.
Worksheet
Veggie Vote: Practicing Counting
Worksheet
Veggie Vote: Practicing Counting
In this worksheet your preschooler will count tally marks to determine which vegetable was the most popular.
Kindergarten
Data and Graphing
Worksheet
Reading Pictographs: Eggplant Cooking
Worksheet
Reading Pictographs: Eggplant Cooking
Third Grade
Data and Graphing
Mr. Chef keeps track of how many eggplants he uses with a pictograph. In this worksheet, kids use information in the pictograph to answer word problems.
Worksheet
Reading Pictographs: Eggplant Cooking
Worksheet
Reading Pictographs: Eggplant Cooking
Mr. Chef keeps track of how many eggplants he uses with a pictograph. In this worksheet, kids use information in the pictograph to answer word problems.
Third Grade
Data and Graphing
Worksheet
Pictographs: Say Cheese!
Worksheet
Pictographs: Say Cheese!
Third Grade
Data and Graphing
To keep track of his cheese sales, Giovanni uses a pictograph. Kids will figure out how his cheese business is doing by using data in the graph.
Worksheet
Pictographs: Say Cheese!
Worksheet
Pictographs: Say Cheese!
To keep track of his cheese sales, Giovanni uses a pictograph. Kids will figure out how his cheese business is doing by using data in the graph.
Third Grade
Data and Graphing
Worksheet
Picture Graphs: What's Your Favorite Ice Cream?
Worksheet
Picture Graphs: What's Your Favorite Ice Cream?
First Grade
Data and Graphing
Vanilla, chocolate, strawberry, or chocolate chip? Sweeten up graph practice with this simple picture graph!
Worksheet
Picture Graphs: What's Your Favorite Ice Cream?
Worksheet
Picture Graphs: What's Your Favorite Ice Cream?
Vanilla, chocolate, strawberry, or chocolate chip? Sweeten up graph practice with this simple picture graph!
First Grade
Data and Graphing
Worksheet
Bounce that Ball: Learn Math While Doing Sports
Activity
Bounce that Ball: Learn Math While Doing Sports
First Grade
Data and Graphing
Head out to the driveway, ball in hand, for a bouncing challenge. Then use those results to make a colorful graph that lets your child compare results.
Activity
Bounce that Ball: Learn Math While Doing Sports
Activity
Bounce that Ball: Learn Math While Doing Sports
Head out to the driveway, ball in hand, for a bouncing challenge. Then use those results to make a colorful graph that lets your child compare results.
First Grade
Data and Graphing
Activity
Using Election Data
Worksheet
Using Election Data
Second Grade
Data and Graphing
Practice reading election data with this data analysis worksheet!
Worksheet
Using Election Data
Worksheet
Using Election Data
Practice reading election data with this data analysis worksheet!
Second Grade
Data and Graphing
Worksheet
Reading Pictographs: Tomato Fest!
Worksheet
Reading Pictographs: Tomato Fest!
Third Grade
Data and Graphing
The farmers are busy picking tomatoes! Kids practice reading a pictograph to help Mr. Farmer figure out how many tomatoes he picked in this worksheet.
Worksheet
Reading Pictographs: Tomato Fest!
Worksheet
Reading Pictographs: Tomato Fest!
The farmers are busy picking tomatoes! Kids practice reading a pictograph to help Mr. Farmer figure out how many tomatoes he picked in this worksheet.
Third Grade
Data and Graphing
Worksheet
Reading Pictographs: Carrots for Bunnies
Worksheet
Reading Pictographs: Carrots for Bunnies
Third Grade
Data and Graphing
How many carrots did Sammy's pet bunny eat? Kids use information in the pictograph to answer word problems in this bunny-filled math worksheet.
Worksheet
Reading Pictographs: Carrots for Bunnies
Worksheet
Reading Pictographs: Carrots for Bunnies
How many carrots did Sammy's pet bunny eat? Kids use information in the pictograph to answer word problems in this bunny-filled math worksheet.
Third Grade
Data and Graphing
Worksheet
Musical Instruments Pie Chart
Worksheet
Musical Instruments Pie Chart
Second Grade
Data and Graphing
Pie makes pretty much anything better, especially math. Help your kid learn about graphs with this nonthreatening pie chart featuring musical instruments.
Worksheet
Musical Instruments Pie Chart
Worksheet
Musical Instruments Pie Chart
Pie makes pretty much anything better, especially math. Help your kid learn about graphs with this nonthreatening pie chart featuring musical instruments.
Second Grade
Data and Graphing
Worksheet
Weather Log
Worksheet
Weather Log
First Grade
Measurement
Rain or shine, get ready for some weather watching! Record data to observe the weather patterns over the course of a week.
Worksheet
Weather Log
Worksheet
Weather Log
Rain or shine, get ready for some weather watching! Record data to observe the weather patterns over the course of a week.
First Grade
Measurement
Worksheet
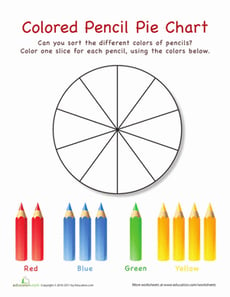
Pie Chart Practice: Colored Pencils
Worksheet
Pie Chart Practice: Colored Pencils
Second Grade
Data and Graphing
Your child might not be ready for statistics, but they can practice using pie charts with this fun, cute worksheet.
Worksheet
Pie Chart Practice: Colored Pencils
Worksheet
Pie Chart Practice: Colored Pencils
Your child might not be ready for statistics, but they can practice using pie charts with this fun, cute worksheet.
Second Grade
Data and Graphing
Worksheet
Do a Survey! Favorite Veggies
Worksheet
Do a Survey! Favorite Veggies
Second Grade
Data and Graphing
Give your second grader some practice working with data with this fun-to-complete favorite veggie survey.
Worksheet
Do a Survey! Favorite Veggies
Worksheet
Do a Survey! Favorite Veggies
Give your second grader some practice working with data with this fun-to-complete favorite veggie survey.
Second Grade
Data and Graphing
Worksheet
Christmas Graphing
Worksheet
Christmas Graphing
Second Grade
Data and Graphing
Use a pictograph to find out how many presents Minnie wrapped this year.
Worksheet
Christmas Graphing
Worksheet
Christmas Graphing
Use a pictograph to find out how many presents Minnie wrapped this year.
Second Grade
Data and Graphing
Worksheet
Reading Pictographs: Going to the Theater
Worksheet
Reading Pictographs: Going to the Theater
Third Grade
Data and Graphing
In this 3rd grade math worksheet, kids practice interpreting graph data as they use the information in a pictograph to answer a set of questions.
Worksheet
Reading Pictographs: Going to the Theater
Worksheet
Reading Pictographs: Going to the Theater
In this 3rd grade math worksheet, kids practice interpreting graph data as they use the information in a pictograph to answer a set of questions.
Third Grade
Data and Graphing
Worksheet
Tally Time: At the Farmers Market
Worksheet
Tally Time: At the Farmers Market
First Grade
Data and Graphing
The farmer needs help keeping track of his vegetables. Can your child use her counting skills to give him a hand?
Worksheet
Tally Time: At the Farmers Market
Worksheet
Tally Time: At the Farmers Market
The farmer needs help keeping track of his vegetables. Can your child use her counting skills to give him a hand?
First Grade
Data and Graphing
Worksheet
Tally Chart: At the Sushi Counter
Worksheet
Tally Chart: At the Sushi Counter
First Grade
Data and Graphing
The chef made a lot of sushi today during lunch. Can your child help him figure out how much sushi he made by filling in the table with tally marks?
Worksheet
Tally Chart: At the Sushi Counter
Worksheet
Tally Chart: At the Sushi Counter
The chef made a lot of sushi today during lunch. Can your child help him figure out how much sushi he made by filling in the table with tally marks?
First Grade
Data and Graphing
Worksheet
1
2
3