Mean, Median, and Mode Resources
14 results
Math
✕Sort by:
14 results
Sort by:


About Mean, Median, And Mode Resources
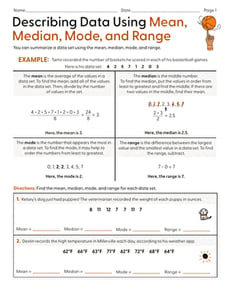
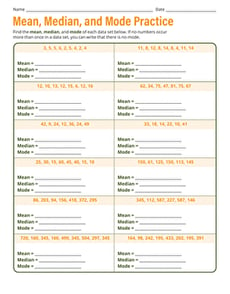
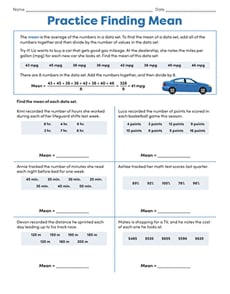
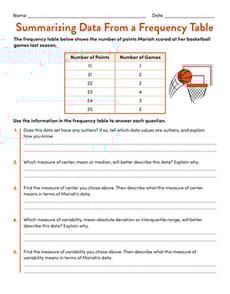
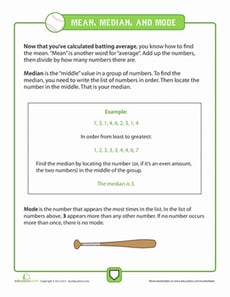
On Education.com, students and teachers can explore a wide range of resources that introduce and practice the concepts of mean, median, and mode. These lessons help learners understand how to analyze data by calculating averages, identifying middle values, and finding the most frequently occurring numbers. Materials include practice worksheets, interactive exercises, and real-world examples that make concepts more accessible and engaging for 4th and 5th-grade students.
Additionally, the site offers videos, printable data sets, and digital games that reinforce counting, sorting, and interpreting data. These resources support classroom instruction, homework activities, and at-home learning, providing educators and parents with structured tools to teach basic statistical concepts effectively. Using hands-on materials, learners can gain confidence in working with numbers and applying mathematical concepts to everyday data sets.
For caregivers and teachers aiming to make learning about mean, median, and mode engaging, Education.com provides practical, colorful activities and readiness skills. The resources cover foundational data analysis, encouraging critical thinking, problem-solving, and mathematical reasoning. Structured to enhance both understanding and application, these materials prepare students for more advanced math topics and everyday number sense.