SKIP TO CONTENT
Worksheet Generator
Subjects
Grades
Worksheets
Games
Build a Worksheet
More Resources
Roly Recommends
Subjects
Grades
Worksheets
Games
Build a Worksheet
More Resources
Roly Recommends
All Subjects
Math
Subtopics:
Mixed Operations
Fractions
Decimals
Integers and Rational Numbers
Exponents and Roots
Number Theory
Ratios and Proportions
Algebra
Geometry
Measurement
Data and Graphing
Probability
Statistics
Math Puzzles
Show Less
Filters
Search for: interpretting, data, using, graphs, recipes
✕
Math
✕
Middle School
✕
Subjects
Math
English Language Arts
Science
Social Studies
Grade Level
Pre-K
K
1st
2nd
3rd
4th
5th
6th
7th
8th
Early Childhood
Elementary School
Middle School
Resource Type
Worksheets
Games
Lesson Plans
Interactive Worksheets
Offline Games
Teacher Resources
Occasion
St. Patrick's Day
Spring
Easter
Earth Day
Fall
Halloween
Winter
Holidays
Common Core
Yes
No
Game Type
Mazes
Puzzles & Sudoku
See More
Clear All
View 360 results
Showing Results for interpretting data using graphs recipes
360 results
Search for: interpretting, data, using, graphs, recipes
✕
Math
✕
Middle School
✕
Clear All
Sort by:
Relevance
Most recent
Most popular
Alphabetical A-Z
Alphabetical Z-A
All filters
360 results
Sort by:
Relevance
Most recent
Most popular
Alphabetical A-Z
Alphabetical Z-A
Find the Missing Data Using the Mean #1
Worksheet
Find the Missing Data Using the Mean #1
Sixth Grade
Statistics
Reveal missing data using the mean with this engaging math worksheet!
Worksheet
Find the Missing Data Using the Mean #1
Worksheet
Find the Missing Data Using the Mean #1
Reveal missing data using the mean with this engaging math worksheet!
Sixth Grade
Statistics
Worksheet
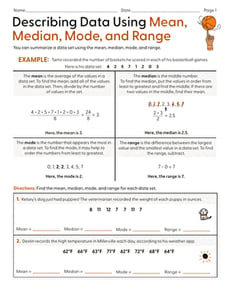
Describing Data Using Mean, Median, Mode, and Range
Worksheet
Describing Data Using Mean, Median, Mode, and Range
Sixth Grade
Statistics
Students describe data using measures of center and a measure of variability in this statistics worksheet for middle grades!
Worksheet
Describing Data Using Mean, Median, Mode, and Range
Worksheet
Describing Data Using Mean, Median, Mode, and Range
Students describe data using measures of center and a measure of variability in this statistics worksheet for middle grades!
Sixth Grade
Statistics
Worksheet
Create Histograms From Data Sets
Worksheet
Create Histograms From Data Sets
Sixth Grade
Data and Graphing
Draw data to show a scientist’s findings in this practical worksheet!
Worksheet
Create Histograms From Data Sets
Worksheet
Create Histograms From Data Sets
Draw data to show a scientist’s findings in this practical worksheet!
Sixth Grade
Data and Graphing
Worksheet
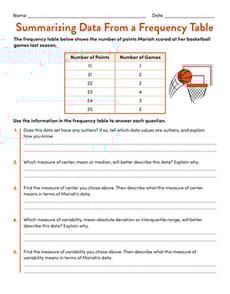
Summarizing Data From a Frequency Table
Worksheet
Summarizing Data From a Frequency Table
Sixth Grade
Data and Graphing
Practice summarizing a numerical data set with this one-page statistics worksheet!
Worksheet
Summarizing Data From a Frequency Table
Worksheet
Summarizing Data From a Frequency Table
Practice summarizing a numerical data set with this one-page statistics worksheet!
Sixth Grade
Data and Graphing
Worksheet
Drawing Inferences Using Data
Worksheet
Drawing Inferences Using Data
Seventh Grade
Data and Graphing
Students compare different survey methods to make inferences about how much time students at a school spend playing video games in this seventh-grade math worksheet.
Worksheet
Drawing Inferences Using Data
Worksheet
Drawing Inferences Using Data
Students compare different survey methods to make inferences about how much time students at a school spend playing video games in this seventh-grade math worksheet.
Seventh Grade
Data and Graphing
Worksheet
Calculating Slope from Tables and Graphs: Matching #2
Worksheet
Calculating Slope from Tables and Graphs: Matching #2
Eighth Grade
Algebra
Carefully calculate slope using tables and graphs in this worksheet!
Worksheet
Calculating Slope from Tables and Graphs: Matching #2
Worksheet
Calculating Slope from Tables and Graphs: Matching #2
Carefully calculate slope using tables and graphs in this worksheet!
Eighth Grade
Algebra
Worksheet
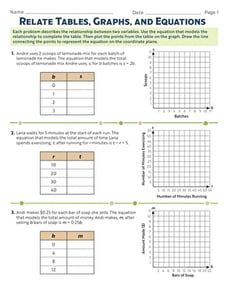
Relate Tables, Graphs, and Equations
Worksheet
Relate Tables, Graphs, and Equations
Sixth Grade
Algebra
Students analyze relationships between two variables using equations, tables, and graphs in this sixth-grade algebra worksheet!
Worksheet
Relate Tables, Graphs, and Equations
Worksheet
Relate Tables, Graphs, and Equations
Students analyze relationships between two variables using equations, tables, and graphs in this sixth-grade algebra worksheet!
Sixth Grade
Algebra
Worksheet
Calculating Slope from Tables and Graphs: Matching #1
Worksheet
Calculating Slope from Tables and Graphs: Matching #1
Eighth Grade
Algebra
Scope out slopes using tables and graphs with this eighth-grade worksheet!
Worksheet
Calculating Slope from Tables and Graphs: Matching #1
Worksheet
Calculating Slope from Tables and Graphs: Matching #1
Scope out slopes using tables and graphs with this eighth-grade worksheet!
Eighth Grade
Algebra
Worksheet
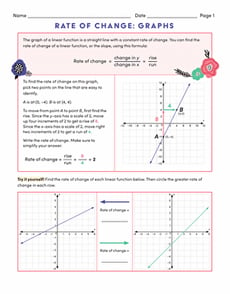
Rate of Change: Graphs
Worksheet
Rate of Change: Graphs
Eighth Grade
Algebra
In Rate of Change: Graphs, eighth-grade learners will learn how to read graphs of linear functions to find the rate of change.
Worksheet
Rate of Change: Graphs
Worksheet
Rate of Change: Graphs
In Rate of Change: Graphs, eighth-grade learners will learn how to read graphs of linear functions to find the rate of change.
Eighth Grade
Algebra
Worksheet
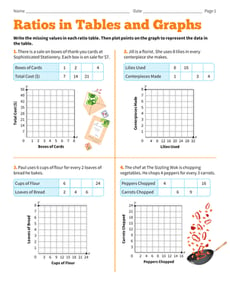
Ratios in Tables and Graphs
Worksheet
Ratios in Tables and Graphs
Sixth Grade
Ratios and Proportions
Practice filling in ratios in tables and graphs with this sixth-grade math worksheet!
Worksheet
Ratios in Tables and Graphs
Worksheet
Ratios in Tables and Graphs
Practice filling in ratios in tables and graphs with this sixth-grade math worksheet!
Sixth Grade
Ratios and Proportions
Worksheet
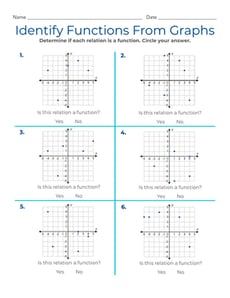
Identify Functions From Graphs
Interactive Worksheet
Identify Functions From Graphs
Eighth Grade
Algebra
Get practice identifying functions from graphs with this eighth-grade algebra worksheet!
Interactive Worksheet
Identify Functions From Graphs
Interactive Worksheet
Identify Functions From Graphs
Get practice identifying functions from graphs with this eighth-grade algebra worksheet!
Eighth Grade
Algebra
Interactive Worksheet
Identify Proportional Relationships From Graphs
Worksheet
Identify Proportional Relationships From Graphs
Seventh Grade
Ratios and Proportions
Practice identifying proportional relationships from graphs with this two-page math worksheet!
Worksheet
Identify Proportional Relationships From Graphs
Worksheet
Identify Proportional Relationships From Graphs
Practice identifying proportional relationships from graphs with this two-page math worksheet!
Seventh Grade
Ratios and Proportions
Worksheet
Creating Histograms From Frequency Tables
Worksheet
Creating Histograms From Frequency Tables
Sixth Grade
Data and Graphing
Practice using histograms to show different sets of data in this engaging sixth-grade worksheet!
Worksheet
Creating Histograms From Frequency Tables
Worksheet
Creating Histograms From Frequency Tables
Practice using histograms to show different sets of data in this engaging sixth-grade worksheet!
Sixth Grade
Data and Graphing
Worksheet
Interpreting Graphs of Proportional Relationships
Interactive Worksheet
Interpreting Graphs of Proportional Relationships
Seventh Grade
Ratios and Proportions
Practice analyzing graphs that represent proportional relationships in the real world with this seventh- and eighth-grade math worksheet!
Interactive Worksheet
Interpreting Graphs of Proportional Relationships
Interactive Worksheet
Interpreting Graphs of Proportional Relationships
Practice analyzing graphs that represent proportional relationships in the real world with this seventh- and eighth-grade math worksheet!
Seventh Grade
Ratios and Proportions
Interactive Worksheet
Identify Linear and Nonlinear Functions From Graphs
Interactive Worksheet
Identify Linear and Nonlinear Functions From Graphs
Eighth Grade
Algebra
Practice differentiating between linear and nonlinear functions based on graphs in this eighth-grade algebra worksheet!
Interactive Worksheet
Identify Linear and Nonlinear Functions From Graphs
Interactive Worksheet
Identify Linear and Nonlinear Functions From Graphs
Practice differentiating between linear and nonlinear functions based on graphs in this eighth-grade algebra worksheet!
Eighth Grade
Algebra
Interactive Worksheet
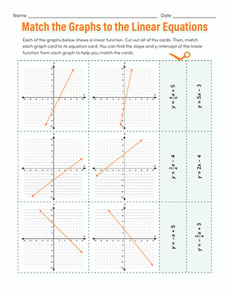
Match the Graphs to the Linear Equations
Worksheet
Match the Graphs to the Linear Equations
Eighth Grade
Algebra
Use this hands-on card matching activity to help students practice matching graphs to their corresponding linear equations!
Worksheet
Match the Graphs to the Linear Equations
Worksheet
Match the Graphs to the Linear Equations
Use this hands-on card matching activity to help students practice matching graphs to their corresponding linear equations!
Eighth Grade
Algebra
Worksheet
Histograms
Worksheet
Histograms
Sixth Grade
Data and Graphing
In this sixth-grade data and graphing worksheet, students will complete histograms from given data sets and frequency tables.
Worksheet
Histograms
Worksheet
Histograms
In this sixth-grade data and graphing worksheet, students will complete histograms from given data sets and frequency tables.
Sixth Grade
Data and Graphing
Worksheet
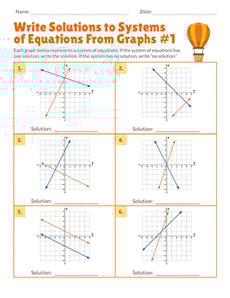
Write Solutions to Systems of Equations From Graphs #1
Worksheet
Write Solutions to Systems of Equations From Graphs #1
Eighth Grade
Algebra
Use your knowledge of graphs and linear equations to track down the solutions to systems of equations!
Worksheet
Write Solutions to Systems of Equations From Graphs #1
Worksheet
Write Solutions to Systems of Equations From Graphs #1
Use your knowledge of graphs and linear equations to track down the solutions to systems of equations!
Eighth Grade
Algebra
Worksheet
Practice Finding Median
Worksheet
Practice Finding Median
Sixth Grade
Statistics
Practice finding the median of a data set with this data worksheet!
Worksheet
Practice Finding Median
Worksheet
Practice Finding Median
Practice finding the median of a data set with this data worksheet!
Sixth Grade
Statistics
Worksheet
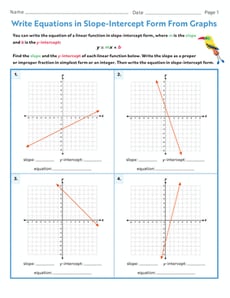
Write Equations in Slope-Intercept Form From Graphs
Worksheet
Write Equations in Slope-Intercept Form From Graphs
Eighth Grade
Algebra
Students gain practice writing equations in slope-intercept form from graphs in this eighth-grade algebra worksheet!
Worksheet
Write Equations in Slope-Intercept Form From Graphs
Worksheet
Write Equations in Slope-Intercept Form From Graphs
Students gain practice writing equations in slope-intercept form from graphs in this eighth-grade algebra worksheet!
Eighth Grade
Algebra
Worksheet
Constructing Scatter Plots
Worksheet
Constructing Scatter Plots
Eighth Grade
Data and Graphing
Get students creating scatter plots using real-world data sets with this eighth-grade math worksheet!
Worksheet
Constructing Scatter Plots
Worksheet
Constructing Scatter Plots
Get students creating scatter plots using real-world data sets with this eighth-grade math worksheet!
Eighth Grade
Data and Graphing
Worksheet
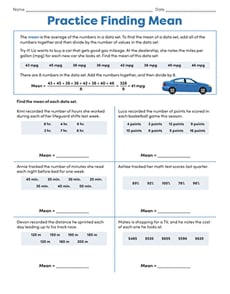
Practice Finding Mean
Interactive Worksheet
Practice Finding Mean
Sixth Grade
Statistics
Give learners practice finding the mean of a data set with this sixth-grade data and statistics worksheet!
Interactive Worksheet
Practice Finding Mean
Interactive Worksheet
Practice Finding Mean
Give learners practice finding the mean of a data set with this sixth-grade data and statistics worksheet!
Sixth Grade
Statistics
Interactive Worksheet
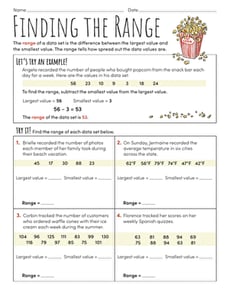
Practice Finding Range
Worksheet
Practice Finding Range
Sixth Grade
Data and Graphing
Give your students practice finding the range of a data set with this sixth-grade data and graphing worksheet!
Worksheet
Practice Finding Range
Worksheet
Practice Finding Range
Give your students practice finding the range of a data set with this sixth-grade data and graphing worksheet!
Sixth Grade
Data and Graphing
Worksheet
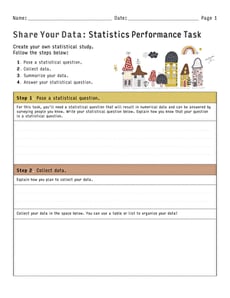
Share Your Data: Statistics Performance Task
Worksheet
Share Your Data: Statistics Performance Task
Sixth Grade
Data and Graphing
Create your own statistical study with this open-ended math worksheet for sixth graders!
Worksheet
Share Your Data: Statistics Performance Task
Worksheet
Share Your Data: Statistics Performance Task
Create your own statistical study with this open-ended math worksheet for sixth graders!
Sixth Grade
Data and Graphing
Worksheet
Creating Box Plots
Worksheet
Creating Box Plots
Sixth Grade
Data and Graphing
Learn to draw your own box plots to show data in this informative sixth-grade worksheet!
Worksheet
Creating Box Plots
Worksheet
Creating Box Plots
Learn to draw your own box plots to show data in this informative sixth-grade worksheet!
Sixth Grade
Data and Graphing
Worksheet
Let's Draw: Create Line Plots
Worksheet
Let's Draw: Create Line Plots
Sixth Grade
Data and Graphing
Use data from a farmers' market to create your own line plots in this sixth-grade worksheet!
Worksheet
Let's Draw: Create Line Plots
Worksheet
Let's Draw: Create Line Plots
Use data from a farmers' market to create your own line plots in this sixth-grade worksheet!
Sixth Grade
Data and Graphing
Worksheet
From Dot Plots to Histograms
Worksheet
From Dot Plots to Histograms
Sixth Grade
Data and Graphing
Discover different ways to display data in this delightful sixth-grade worksheet!
Worksheet
From Dot Plots to Histograms
Worksheet
From Dot Plots to Histograms
Discover different ways to display data in this delightful sixth-grade worksheet!
Sixth Grade
Data and Graphing
Worksheet
Finding the Range
Interactive Worksheet
Finding the Range
Sixth Grade
Statistics
Introduce students to ranges and data sets with this middle grades math worksheet!
Interactive Worksheet
Finding the Range
Interactive Worksheet
Finding the Range
Introduce students to ranges and data sets with this middle grades math worksheet!
Sixth Grade
Statistics
Interactive Worksheet
Describing Distributions in Histograms
Worksheet
Describing Distributions in Histograms
Sixth Grade
Data and Graphing
Help students deepen their understanding of histograms with this this two-page data and graphing worksheet!
Worksheet
Describing Distributions in Histograms
Worksheet
Describing Distributions in Histograms
Help students deepen their understanding of histograms with this this two-page data and graphing worksheet!
Sixth Grade
Data and Graphing
Worksheet
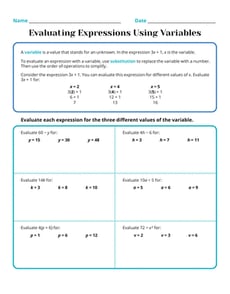
Evaluating Expressions Using Variables
Interactive Worksheet
Evaluating Expressions Using Variables
Sixth Grade
Algebra
Master evaluating expressions using variables with this worksheet! Plug in three different values of the variable. Then simplify using the order of operations.
Interactive Worksheet
Evaluating Expressions Using Variables
Interactive Worksheet
Evaluating Expressions Using Variables
Master evaluating expressions using variables with this worksheet! Plug in three different values of the variable. Then simplify using the order of operations.
Sixth Grade
Algebra
Interactive Worksheet
1
2
3
4
…
12