SKIP TO CONTENT
Worksheet Generator
Subjects
Grades
Worksheets
Games
Build a Worksheet
More Resources
Roly Recommends
Subjects
Grades
Worksheets
Games
Build a Worksheet
More Resources
Roly Recommends
All Subjects
Math
Data and Graphing
Subtopics:
Collecting and Organizing Data
Picture Graphs
Bar Graphs
Line Plots
Coordinate Plane
Box Plots
Histograms
Scatter Plots
Show Less
Filters
Search for: -identifying-three-digit-
✕
Math
✕
Worksheets
✕
Subjects
Math
English Language Arts
Science
Social Studies
Foreign Language
Grade Level
Pre-K
K
1st
2nd
3rd
4th
5th
6th
7th
8th
Early Childhood
Elementary School
Middle School
Resource Type
Worksheets
Games
Lesson Plans
Interactive Worksheets
Workbooks
Activities
Exercises
Stories
Songs
Offline Games
Guided Lessons
Teacher Resources
Occasion
St. Patrick's Day
Earth Day
Summer
Back to School
Fall
Halloween
Winter
Holidays
Thanksgiving
Christmas
Valentine's Day
Common Core
Yes
Game Type
Mazes
Printable Board Games
Travel Games
Arts & Crafts
Arts & Crafts
Paper & Glue Crafts
Coloring
Yes
See More
Clear All
View 449 results
Showing Results for -identifying-three-digit- : Page 5
449 results
Search for: -identifying-three-digit-
✕
Math
✕
Worksheets
✕
Clear All
Sort by:
Relevance
Most recent
Most popular
Alphabetical A-Z
Alphabetical Z-A
All filters
449 results
Sort by:
Relevance
Most recent
Most popular
Alphabetical A-Z
Alphabetical Z-A
Pick a Flower Pictograph
Worksheet
Pick a Flower Pictograph
Second Grade
Data and Graphing
Find out exactly how many flowers Stefanie has planted with this pictograph for kids. Your child will learn how to analyze and interpret data.
Worksheet
Pick a Flower Pictograph
Worksheet
Pick a Flower Pictograph
Find out exactly how many flowers Stefanie has planted with this pictograph for kids. Your child will learn how to analyze and interpret data.
Second Grade
Data and Graphing
Worksheet
Picnic Bar Graph
Worksheet
Picnic Bar Graph
Second Grade
Data and Graphing
Which picnic games do you prefer? This bar graph shows some of the most popular picnic activities. Students will learn about analyzing data from a bar graph.
Worksheet
Picnic Bar Graph
Worksheet
Picnic Bar Graph
Which picnic games do you prefer? This bar graph shows some of the most popular picnic activities. Students will learn about analyzing data from a bar graph.
Second Grade
Data and Graphing
Worksheet
Pool Toys Pie Chart
Worksheet
Pool Toys Pie Chart
Second Grade
Data and Graphing
Sue found out people's favorite pool toys and posted her results in a pie chart. Students practice their analytical skills by coming up their own questions.
Worksheet
Pool Toys Pie Chart
Worksheet
Pool Toys Pie Chart
Sue found out people's favorite pool toys and posted her results in a pie chart. Students practice their analytical skills by coming up their own questions.
Second Grade
Data and Graphing
Worksheet
Pool Toys Venn Diagram
Worksheet
Pool Toys Venn Diagram
Second Grade
Data and Graphing
Students practice creating a Venn diagram by organizing the pool toys into the correct categories. Students will also learn to differentiate between shapes.
Worksheet
Pool Toys Venn Diagram
Worksheet
Pool Toys Venn Diagram
Students practice creating a Venn diagram by organizing the pool toys into the correct categories. Students will also learn to differentiate between shapes.
Second Grade
Data and Graphing
Worksheet
Summer Hobbies Venn Diagram
Worksheet
Summer Hobbies Venn Diagram
Second Grade
Data and Graphing
Practice reading Venn diagrams with some of the most popular summertime hobbies. Your child will learn to analyze and interpret data by answering questions.
Worksheet
Summer Hobbies Venn Diagram
Worksheet
Summer Hobbies Venn Diagram
Practice reading Venn diagrams with some of the most popular summertime hobbies. Your child will learn to analyze and interpret data by answering questions.
Second Grade
Data and Graphing
Worksheet
The BBQ Tally
Worksheet
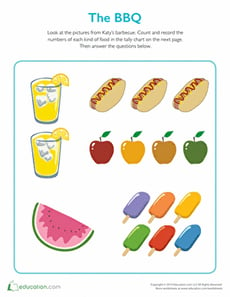
The BBQ Tally
Second Grade
Data and Graphing
Your student will use the colorful pictures to count the number of food items that were consumed and record the information using the tally chart provided.
Worksheet
The BBQ Tally
Worksheet
The BBQ Tally
Your student will use the colorful pictures to count the number of food items that were consumed and record the information using the tally chart provided.
Second Grade
Data and Graphing
Worksheet
Experimental Probability Models
Worksheet
Experimental Probability Models
Seventh Grade
Data and Graphing
Use this seventh-grade math worksheet to introduce students to the concept of experimental probability models.
Worksheet
Experimental Probability Models
Worksheet
Experimental Probability Models
Use this seventh-grade math worksheet to introduce students to the concept of experimental probability models.
Seventh Grade
Data and Graphing
Worksheet
Make Predictions Using Theoretical Probability
Interactive Worksheet
Make Predictions Using Theoretical Probability
Seventh Grade
Data and Graphing
In this seventh-grade probability worksheet, students will practice finding the theoretical probabilities for different events and using those to make predictions.
Interactive Worksheet
Make Predictions Using Theoretical Probability
Interactive Worksheet
Make Predictions Using Theoretical Probability
In this seventh-grade probability worksheet, students will practice finding the theoretical probabilities for different events and using those to make predictions.
Seventh Grade
Data and Graphing
Interactive Worksheet
Making Comparative Inferences
Worksheet
Making Comparative Inferences
Seventh Grade
Data and Graphing
Give students practice creating box plots and making comparative inferences with this seventh-grade math worksheet!
Worksheet
Making Comparative Inferences
Worksheet
Making Comparative Inferences
Give students practice creating box plots and making comparative inferences with this seventh-grade math worksheet!
Seventh Grade
Data and Graphing
Worksheet
Make Predictions Using Experimental Probability
Interactive Worksheet
Make Predictions Using Experimental Probability
Seventh Grade
Data and Graphing
In this seventh-grade probability worksheet, students are introduced to the concept of experimental probability and shown how to use this information to make predictions.
Interactive Worksheet
Make Predictions Using Experimental Probability
Interactive Worksheet
Make Predictions Using Experimental Probability
In this seventh-grade probability worksheet, students are introduced to the concept of experimental probability and shown how to use this information to make predictions.
Seventh Grade
Data and Graphing
Interactive Worksheet
Dot Plots
Worksheet
Dot Plots
Sixth Grade
Data and Graphing
Covering a variety of interesting real-life contexts, this two-page math worksheet gives learners practice turning data sets into dot plots that are representative of each scenario.
Worksheet
Dot Plots
Worksheet
Dot Plots
Covering a variety of interesting real-life contexts, this two-page math worksheet gives learners practice turning data sets into dot plots that are representative of each scenario.
Sixth Grade
Data and Graphing
Worksheet
Histograms
Worksheet
Histograms
Sixth Grade
Data and Graphing
In this sixth-grade data and graphing worksheet, students will complete histograms from given data sets and frequency tables.
Worksheet
Histograms
Worksheet
Histograms
In this sixth-grade data and graphing worksheet, students will complete histograms from given data sets and frequency tables.
Sixth Grade
Data and Graphing
Worksheet
Graphing Proportional Relationships
Worksheet
Graphing Proportional Relationships
Eighth Grade
Ratios and Proportions
Practice graphing proportional relationships and finding the constant of proportionality with this eighth-grade math worksheet!
Worksheet
Graphing Proportional Relationships
Worksheet
Graphing Proportional Relationships
Practice graphing proportional relationships and finding the constant of proportionality with this eighth-grade math worksheet!
Eighth Grade
Ratios and Proportions
Worksheet
Estimating Lines of Best Fit
Worksheet
Estimating Lines of Best Fit
Eighth Grade
Data and Graphing
Students estimate and sketch lines of best fit on various scatter plots and describe the association displayed on each.
Worksheet
Estimating Lines of Best Fit
Worksheet
Estimating Lines of Best Fit
Students estimate and sketch lines of best fit on various scatter plots and describe the association displayed on each.
Eighth Grade
Data and Graphing
Worksheet
Translations on the Coordinate Plane
Worksheet
Translations on the Coordinate Plane
Eighth Grade
Geometry
In this eighth-grade geometry worksheet, students practice graphing images of figures after completing translations on a coordinate plane.
Worksheet
Translations on the Coordinate Plane
Worksheet
Translations on the Coordinate Plane
In this eighth-grade geometry worksheet, students practice graphing images of figures after completing translations on a coordinate plane.
Eighth Grade
Geometry
Worksheet
Rotations on the Coordinate Plane
Worksheet
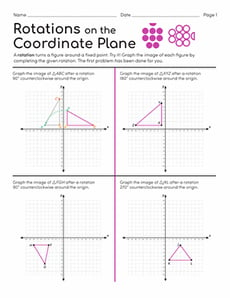
Rotations on the Coordinate Plane
Eighth Grade
Geometry
Students practice graphing images of figures after completing rotations of 90°, 180°, or 270° counterclockwise around the origin.
Worksheet
Rotations on the Coordinate Plane
Worksheet
Rotations on the Coordinate Plane
Students practice graphing images of figures after completing rotations of 90°, 180°, or 270° counterclockwise around the origin.
Eighth Grade
Geometry
Worksheet
Reflections on the Coordinate Plane
Worksheet
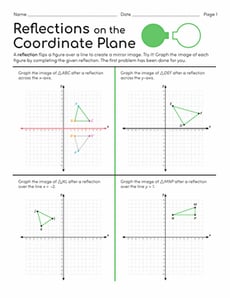
Reflections on the Coordinate Plane
Eighth Grade
Geometry
This eighth-grade geometry worksheet gives students practice graphing images of figures after completing given reflections on coordinate planes.
Worksheet
Reflections on the Coordinate Plane
Worksheet
Reflections on the Coordinate Plane
This eighth-grade geometry worksheet gives students practice graphing images of figures after completing given reflections on coordinate planes.
Eighth Grade
Geometry
Worksheet
Dilations on the Coordinate Plane
Worksheet
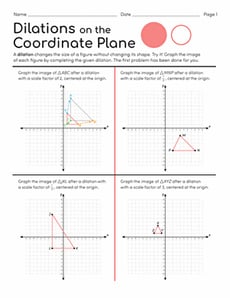
Dilations on the Coordinate Plane
Eighth Grade
Geometry
In Dilations on the Coordinate Plane, students will practice graphing images of figures after completing given dilations, all of which are centered at the origin.
Worksheet
Dilations on the Coordinate Plane
Worksheet
Dilations on the Coordinate Plane
In Dilations on the Coordinate Plane, students will practice graphing images of figures after completing given dilations, all of which are centered at the origin.
Eighth Grade
Geometry
Worksheet
Count and Classify: Kids
Worksheet
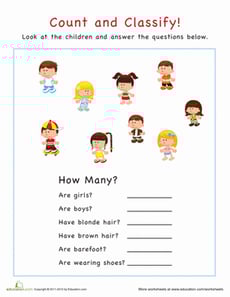
Count and Classify: Kids
Pre-K
Numbers and Counting
Help your child sort these kids using counting and classifying skills. Your child will count, and learn to group and identify by characteristics.
Worksheet
Count and Classify: Kids
Worksheet
Count and Classify: Kids
Help your child sort these kids using counting and classifying skills. Your child will count, and learn to group and identify by characteristics.
Pre-K
Numbers and Counting
Worksheet
Categorization: How Many Hats?
Worksheet
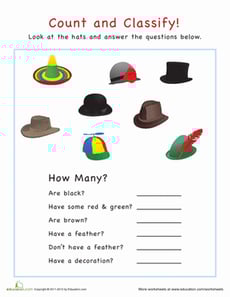
Categorization: How Many Hats?
Pre-K
Numbers and Counting
Help your child sort and classify an array of fun hats in this categorization worksheet. Your kid will count the number of brown, feathered, or decorated hats.
Worksheet
Categorization: How Many Hats?
Worksheet
Categorization: How Many Hats?
Help your child sort and classify an array of fun hats in this categorization worksheet. Your kid will count the number of brown, feathered, or decorated hats.
Pre-K
Numbers and Counting
Worksheet
Count and Classify: Animals
Worksheet
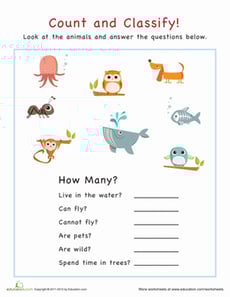
Count and Classify: Animals
Pre-K
Numbers and Counting
Count and classify animals by their habitats and abilities. Help your child work on sorting skills with this count and classify animals worksheet.
Worksheet
Count and Classify: Animals
Worksheet
Count and Classify: Animals
Count and classify animals by their habitats and abilities. Help your child work on sorting skills with this count and classify animals worksheet.
Pre-K
Numbers and Counting
Worksheet
Count and Classify: Fruits and Vegetables
Worksheet
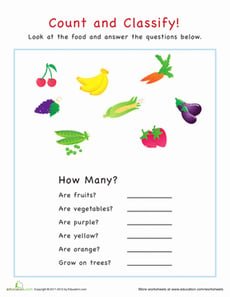
Count and Classify: Fruits and Vegetables
Pre-K
Numbers and Counting
Count and classify your produce beyond fruits and vegetables. Try this fruits and vegetables worksheet to increase your child's sorting skills.
Worksheet
Count and Classify: Fruits and Vegetables
Worksheet
Count and Classify: Fruits and Vegetables
Count and classify your produce beyond fruits and vegetables. Try this fruits and vegetables worksheet to increase your child's sorting skills.
Pre-K
Numbers and Counting
Worksheet
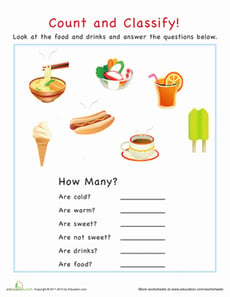
Categorization: Food
Worksheet
Categorization: Food
Pre-K
Numbers and Counting
Blossoming foodies will enjoy our gastronomically focused categorization worksheet. Kids will sort food and drink by type in this food categorization worksheet.
Worksheet
Categorization: Food
Worksheet
Categorization: Food
Blossoming foodies will enjoy our gastronomically focused categorization worksheet. Kids will sort food and drink by type in this food categorization worksheet.
Pre-K
Numbers and Counting
Worksheet
Categorization: How Many Shapes?
Worksheet
Categorization: How Many Shapes?
Pre-K
Numbers and Counting
Young geometry enthusiasts will enjoy sorting and counting the shapes in our categorization worksheet. Your kid will gain early math skills with this worksheet.
Worksheet
Categorization: How Many Shapes?
Worksheet
Categorization: How Many Shapes?
Young geometry enthusiasts will enjoy sorting and counting the shapes in our categorization worksheet. Your kid will gain early math skills with this worksheet.
Pre-K
Numbers and Counting
Worksheet
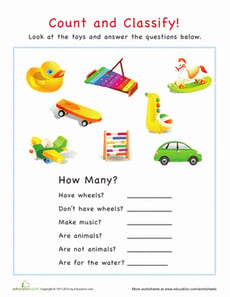
Categorization: How Many Toys?
Worksheet
Categorization: How Many Toys?
Pre-K
Numbers and Counting
Kids will sort and classify toys in this categorizing worksheet. Help your child sort toys by type and uses in this toy categorization worksheet.
Worksheet
Categorization: How Many Toys?
Worksheet
Categorization: How Many Toys?
Kids will sort and classify toys in this categorizing worksheet. Help your child sort toys by type and uses in this toy categorization worksheet.
Pre-K
Numbers and Counting
Worksheet
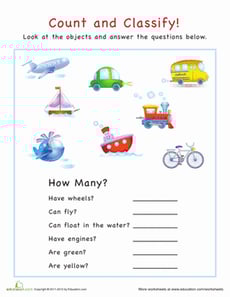
Count and Classify: Vehicles
Worksheet
Count and Classify: Vehicles
Pre-K
Numbers and Counting
Count and classify different kinds of vehicles in this worksheet. Kids will identify what vehicles pictured have wheels, can float, or are green.
Worksheet
Count and Classify: Vehicles
Worksheet
Count and Classify: Vehicles
Count and classify different kinds of vehicles in this worksheet. Kids will identify what vehicles pictured have wheels, can float, or are green.
Pre-K
Numbers and Counting
Worksheet
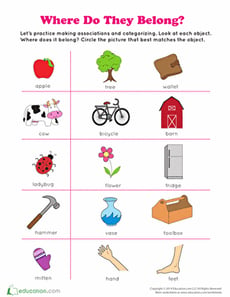
Where Do They Belong?
Worksheet
Where Do They Belong?
Pre-K
Data and Graphing
Where do they belong? Sorting and categorizing is an essential preschool skill! Get some practice with this 2-page worksheet.
Worksheet
Where Do They Belong?
Worksheet
Where Do They Belong?
Where do they belong? Sorting and categorizing is an essential preschool skill! Get some practice with this 2-page worksheet.
Pre-K
Data and Graphing
Worksheet
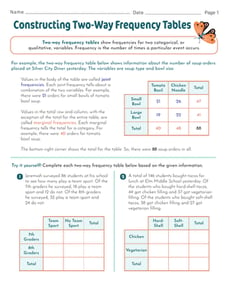
Constructing Two-Way Frequency Tables
Interactive Worksheet
Constructing Two-Way Frequency Tables
Eighth Grade
Data and Graphing
In this eighth-grade math worksheet, learners will then get to practice constructing two-way frequency tables given written descriptions of real-world data.
Interactive Worksheet
Constructing Two-Way Frequency Tables
Interactive Worksheet
Constructing Two-Way Frequency Tables
In this eighth-grade math worksheet, learners will then get to practice constructing two-way frequency tables given written descriptions of real-world data.
Eighth Grade
Data and Graphing
Interactive Worksheet
Constructing Scatter Plots
Worksheet
Constructing Scatter Plots
Eighth Grade
Data and Graphing
Get students creating scatter plots using real-world data sets with this eighth-grade math worksheet!
Worksheet
Constructing Scatter Plots
Worksheet
Constructing Scatter Plots
Get students creating scatter plots using real-world data sets with this eighth-grade math worksheet!
Eighth Grade
Data and Graphing
Worksheet
Mean Absolute Deviation
Worksheet
Mean Absolute Deviation
Sixth Grade
Data and Graphing
Students calculate the mean absolute deviation of data sets in this sixth-grade date and graphing worksheet.
Worksheet
Mean Absolute Deviation
Worksheet
Mean Absolute Deviation
Students calculate the mean absolute deviation of data sets in this sixth-grade date and graphing worksheet.
Sixth Grade
Data and Graphing
Worksheet
1
…
4
5
6
…
15