Histograms Worksheets
About Histograms Worksheets
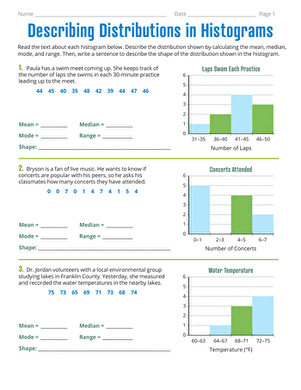
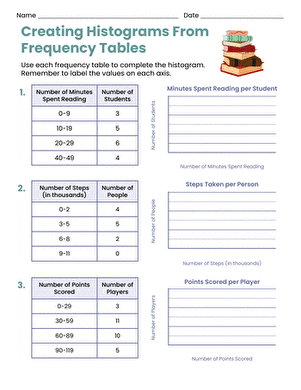
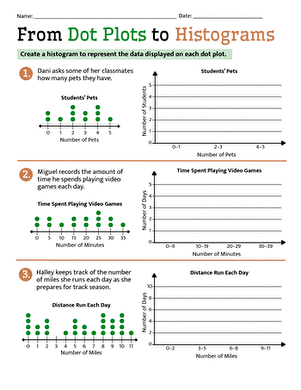
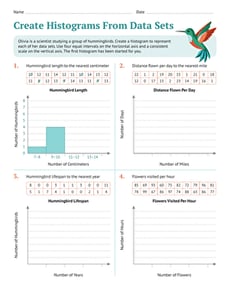
On Education.com, histograms worksheets offer students a chance to explore and interpret data visually by examining bar graphs that display frequency distributions. These printable activities help learners understand how to read histograms, identify patterns, and analyze real-world information. The site provides a variety of worksheets, from beginner exercises to advanced data interpretation, making it easy for educators and parents to find resources suited for all learning levels.
Educators and parents can access lesson plans, digital simulations, and practice worksheets that reinforce statistical concepts through engaging exercises. These materials help students develop critical thinking skills and strengthen their ability to organize and analyze numerical data. By using these resources, learners can build a solid foundation in data representation while applying mathematical concepts to everyday situations.
Using Histogram Worksheets on Education.com supports structured instruction, saving teachers time while providing students with hands-on practice. Parents can utilize these worksheets at home to supplement classroom learning and encourage independent exploration of data analysis. Together, these resources foster understanding of graphical data displays and help children gain confidence in interpreting information.


