
Activity
Comparing Leaf Stomata

Underneath each leaf, in the epidermal tissue, there are small openings called stomata. Surrounding each stomata are guard cells that regulate the opening and closing of the stomata. The stomata allow carbon dioxide into the leaf for photosynthesis and release excess oxygen into the atmosphere as byproduct of photosynthesis. Water is also lost from the plant through the stomata, so the size and number of stomata vary according to the environment and other adaptations of the plant. In this experiment, the student will collect leaf specimen to observe and compare their stomata.
Problem:
Student compares the number and relative sizes of the stomata of various leaf species.
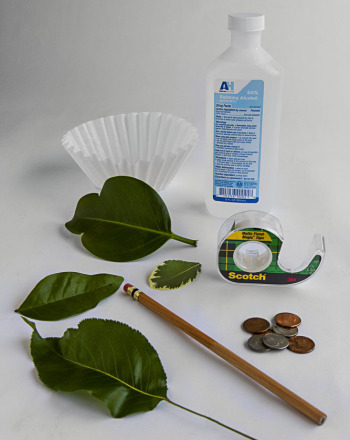
Materials:
- Plant field guide or dichotomous key
- Clear nail polish
- Transparent tape
- Microscope
- Microscope slides
Procedure:
- Collect leaves of 3-5 plant species. Identify the species with a plant field guide or dichotomous key. Create your hypothesis as to which species will have the most stomata and why.
- On the bottom of each leaf, paint a 1 inch square section of clear nail polish. Allow to dry. Place clear tape over each section of nail polish and carefully remove from the leaf. This will give you an impression of the epidermis of the leaf. Fix the tape to a microscope slide and label with the plant species. Repeat for each species that you are testing.
- With the microscope on the lowest setting, focus your slide to see the stomata. Once you have a good view, switch to the next magnification. Look at the stomata from each magnification available. Determine at which magnification the stomata are the most easily viewed. Write this setting down to use with each slide. Draw the stomata and describe their general shape and size. In a single field of view, count the number of stomata. Switch the field of view and count again. Do this a total of 3 times. Repeat the entire procedure for each species. Be sure to use the same magnification setting each time you observe, draw, and count the stomata.
- Calculate the average number of stomata in the field of view and create a bar graph to display your results. Compare your results to your hypothesis to draw a conclusion about the stomata and adaptations of the plants you studied.
Disclaimer and Safety Precautions
Education.com provides the Science Fair Project Ideas for informational purposes only. Education.com does not make any guarantee or representation regarding the Science Fair Project Ideas and is not responsible or liable for any loss or damage, directly or indirectly, caused by your use of such information. By accessing the Science Fair Project Ideas, you waive and renounce any claims against Education.com that arise thereof. In addition, your access to Education.com's website and Science Fair Project Ideas is covered by Education.com's Privacy Policy and site Terms of Use, which include limitations on Education.com's liability.
Warning is hereby given that not all Project Ideas are appropriate for all individuals or in all circumstances. Implementation of any Science Project Idea should be undertaken only in appropriate settings and with appropriate parental or other supervision. Reading and following the safety precautions of all materials used in a project is the sole responsibility of each individual. For further information, consult your state's handbook of Science Safety.
Related learning resources

Comparing Leaf Size and Shape
Activity
Comparing Leaf Size and Shape
Science fair project that compares tree leaf size and shape based on the leaf's position in the tree. Is their is a noticeable difference between high and low?
Science
Activity
Printable Leaf Patterns
Worksheet
Printable Leaf Patterns
These printable leaf patterns are a fun way to learn about the seasons. Plus, printable leaf patterns can be used to practice making patterns.
Preschool
Science
Worksheet
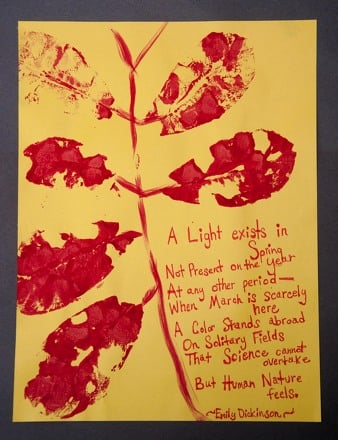
Leaf Printing
Activity
Leaf Printing
Combine your creative fifth grader's love of nature, art and poetry with leaf printing!
5th Grade
Activity