
Activity
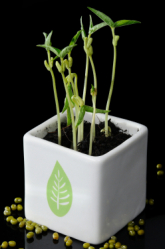
What is Saltwater's Effect on Wheat Grass Plants?

2011 VIRTUAL SCIENCE FAIR ENTRY
Abstract
There are four plants lettered A, B, C, D. The specific plant that was chosen was wheat grass because of its amazing height and its ability to grow faster than most plants. The plants type was abbreviated WG, and then the letter of the plant. For example if it was a Wednesday and the plant WGA was being watered I would put…
Wednesday, December 22, 2010 height=6 inches
WGA watered with ¼ cup water with ¼ teaspoon salt dissolved into the solution.
WGA did not grow since Thursday, December 30, 2010.
The plants shall be watered with a solution of ¼ cup water and (depending on the plant I will water them with) different amounts of salt. But the fourth plant (WGD) will be the control, which means it will only be watered with ¼ cup tap water. As follows:
WGA= No Salt, ¼ cup water
Type
Grade
Difficulty of the Project
Cost
Safety Issues
No safety issues associated with this project.
Objective
The concept that’s being tested is to see how much saltwater a plant can withstand. Also to see what the timeline of the effects are on each plant with the differing amounts of salt being introduced into the water.
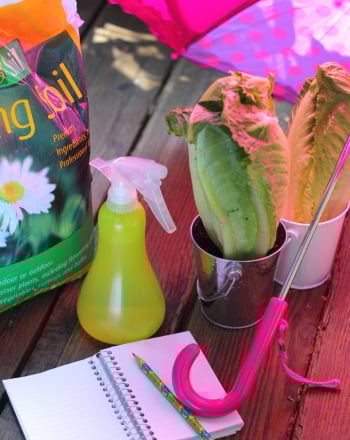
Materials
- Four wheat grass plants in a container
- Measuring cup
- Three measuring spoons: with measurements for ¼ teaspoon, ½ teaspoon, and 1 teaspoon
- Tap water
- Iodized salt
- Ruler
- Notebook
- Pen
- Sharpie
- Camera
Introduction and Background Research
Dehydration
Saltwater negatively affects plants by dehydrating them. Plants obtain water via their root system through osmosis. This osmosis is facilitated by cells around the hairs of the plant's roots that water passes through very easily. When fresh water is present, water is easily passed through the root cells and up through the rest of the plant as needed. However, these highly-permeable root cells work against the plant when the soil has a high salt content. The salt in the soil can actually pull water out of the cells and dehydrate the plant.
Inhibition
Saltwater also affects plants by inhibiting their growth and photosynthetic capabilities. All living organisms need salt, and plants absorb theirs through their root system along with their water. However, in salinated soil, plants absorb too much salt. Unable to get rid of this excess salt, the plant accumulates deposits in its cells that interfere with a variety of plant processes.
Observable Effects
The observable effect that saltwater has on plants depends on just how much salt is in the soil as a result of salt watering. Mild to moderate levels of salt in the soil may simply stunt the plant's growth and reduce its yield. Higher salt levels will lead to plant dehydration, and the plant's leaves will show signs of drought and burn (the leaves will begin to yellow, brown and crinkle on the edges) even if it is being amply watered. If sodium levels are high enough, then the soil will form hard crusty salt layers on the surface and your plant will defoliate and eventually die.
Research Question
Hypothesis
The expectation for this experiment is that the plant with the most amount of salt will wilt first. Also that the control plant will survive the longest, out of the four plants, according to:
Experimental Procedure
Step 1:Obtain plants
To start this experiment you must have at least four plants then label them plant A, plant B, plant C, and plant D. In this case, the plant, wheat grass was used. Three plants were watered with saltwater: plants B, C, and D while plant A will be the control. A control is like the original, for this instance, water is the control because it is the base of saltwater.
Step 2:Figure out the formula for the plants.
All plants are watered with ¼ cup tap water every day.
For example: Plant B is watered with ¼ teaspoon iodized salt, plant C is watered with ½ teaspoon iodized salt, plant D is watered with 1 teaspoon iodized salt, and plant A is the control and is watered with ¼ cup tap water only and no iodized salt.
Step 3: Record the data
Each day the individual plants were measured by height using a ruler, and the data was recorded in a notebook under labels: A, B, C, and D noting the date.
Results
| Date | Height | Status | Salt Intake | Quantity of Water |
| WGA | ||||
| 12/1/2010 | 5 1/2 inches | Green | 0 | 1/4 cup |
| 12/2/2010 | 5 1/2 inches | Green | 0 | 1/4 cup |
| 12/3/2010 | 5 1/2 inches | Green | 0 | 1/4 cup |
| 12/4/2010 | 5 1/2 inches | Green | 0 | 1/4 cup |
| 12/5/2010 | 5 1/2 inches | Green | 0 | 1/4 cup |
| 12/6/2010 | 5 3/4 inches | Green | 0 | 1/4 cup |
| 12/7/2010 | 5 3/4 inches | Green | 0 | 1/4 cup |
| 12/8/2010 | 5 3/4 inches | Green | 0 | 1/4 cup |
| 12/9/2010 | 5 3/4 inches | Green | 0 | 1/4 cup |
| 12/10/2010 | 6 inches | Green | 0 | 1/4 cup |
| 12/11/2010 | 6 inches | Green | 0 | 1/4 cup |
| 12/12/2010 | 6 1/4 inches | Turning Brown | 0 | 1/4 cup |
| 12/13/2010 | 6 1/4 inches | Turning Brown | 0 | 1/4 cup |
| 12/14/2010 | 6 1/4 inches | Turning Brown | 0 | 1/4 cup |
| 12/15/2010 | 6 1/2 inches | Turning Brown | 0 | 1/4 cup |
| 12/16/2010 | 6 1/2 inches | Turning Brown | 0 | 1/4 cup |
| 12/17/2010 | 6 1/2 inches | Brown | 0 | 1/4 cup |
| 12/18/2010 | 6 1/2 inches | Brown | 0 | 1/4 cup |
| 12/19/2010 | 6 3/4 inches | Brown/Wilting | 0 | 1/4 cup |
| 12/20/2010 | 6 3/4 inches | Brown/Wilting | 0 | 1/4 cup |
| 12/21/2010 | 6 3/4 inches | Brown/Wilting | 0 | 1/4 cup |
| 12/22/2010 | 6 3/4 inches | Brown/Wilting | 0 | 1/4 cup |
| WGB | ||||
| 12/1/2010 | 5 1/2 inches | Green | 1/4 tsp | 1/4 cup |
| 12/2/2010 | 5 1/2 inches | Green | 1/4 tsp | 1/4 cup |
| 12/3/2010 | 5 1/2 inches | Green | 1/4 tsp | 1/4 cup |
| 12/4/2010 | 5 1/2 inches | Green | 1/4 tsp | 1/4 cup |
| 12/5/2010 | 5 1/2 inches | Green | 1/4 tsp | 1/4 cup |
| 12/6/2010 | 5 3/4 inches | Green | 1/4 tsp | 1/4 cup |
| 12/7/2010 | 5 3/4 inches | Green | 1/4 tsp | 1/4 cup |
| 12/8/2010 | 5 3/4 inches | Turning Brown | 1/4 tsp | 1/4 cup |
| 12/9/2010 | 5 3/4 inches | Turning Brown | 1/4 tsp | 1/4 cup |
| 12/10/2010 | 6 inches | Turning Brown | 1/4 tsp | 1/4 cup |
| 12/11/2010 | 6 inches | Turning Brown | 1/4 tsp | 1/4 cup |
| 12/12/2010 | 6 inches | Turning Brown | 1/4 tsp | 1/4 cup |
| 12/13/2010 | 6 inches | Turning Brown | 1/4 tsp | 1/4 cup |
| 12/14/2010 | 6 inches | Turning Brown | 1/4 tsp | 1/4 cup |
| 12/15/2010 | 6 inches | Brown/Wilting | 1/4 tsp | 1/4 cup |
| 12/16/2010 | 6 1/4 inches | Brown/Wilting | 1/4 tsp | 1/4 cup |
| 12/17/2010 | 6 1/4 inches | Brown/Wilting | 1/4 tsp | 1/4 cup |
| 12/18/2010 | 6 1/4 inches | Brown/Wilting | 1/4 tsp | 1/4 cup |
| 12/19/2010 | 6 1/4 inches | Brown/Wilting | 1/4 tsp | 1/4 cup |
| 12/20/2010 | 6 1/2 inches | Brown/Wilting | 1/4 tsp | 1/4 cup |
| 12/21/2010 | 6 1/2 inches | Brown/Wilting | 1/4 tsp | 1/4 cup |
| 12/22/2010 | 6 1/2 inches | Brown/Wilting | 1/4 tsp | 1/4 cup |
| WGC | ||||
| 2/1/2010 | 5 1/2 inches | Green | 1/2 tsp | 1/4 cup |
| 12/2/2010 | 5 1/2 inches | Green | 1/2 tsp | 1/4 cup |
| 12/3/2010 | 5 1/2 inches | Green | 1/2 tsp | 1/4 cup |
| 12/4/2010 | 5 1/2 inches | Turning Brown | 1/2 tsp | 1/4 cup |
| 12/5/2010 | 5 1/2 inches | Turning Brown | 1/2 tsp | 1/4 cup |
| 12/6/2010 | 5 3/4 inches | Turning Brown | 1/2 tsp | 1/4 cup |
| 12/7/2010 | 5 3/4 inches | Turning Brown | 1/2 tsp | 1/4 cup |
| 12/8/2010 | 5 3/4 inches | Turning Brown | 1/2 tsp | 1/4 cup |
| 12/9/2010 | 5 3/4 inches | Turning Brown | 1/2 tsp | 1/4 cup |
| 12/10/2010 | 6 inches | Turning Brown | 1/2 tsp | 1/4 cup |
| 12/11/2010 | 6 inches | Turning Brown | 1/2 tsp | 1/4 cup |
| 12/12/2010 | 6 inches | Turning Brown | 1/2 tsp | 1/4 cup |
| 12/13/2010 | 6 inches | Turning Brown | 1/2 tsp | 1/4 cup |
| 12/14/2010 | 6 inches | Turning Brown | 1/2 tsp | 1/4 cup |
| 12/15/2010 | 6 inches | Brown/Wilting | 1/2 tsp | 1/4 cup |
| 12/16/2010 | 6 inches | Brown/Wilting | 1/2 tsp | 1/4 cup |
| 12/17/2010 | 6 inches | Brown/Wilting | 1/2 tsp | 1/4 cup |
| 12/18/2010 | 6 inches | Brown/Wilting | 1/2 tsp | 1/4 cup |
| 12/19/2010 | 6 inches | Brown/Wilting | 1/2 tsp | 1/4 cup |
| 12/20/2010 | 6 inches | Brown/Wilting | 1/2 tsp | 1/4 cup |
| 12/21/2010 | 6 inches | Brown/Wilting | 1/2 tsp | 1/4 cup |
| 12/22/2010 | 6 inches | Brown/Wilting | 1/2 tsp | 1/4 cup |
| WGD | ||||
| 12/1/2010 | 5 1/2 inches | Green | 1 tsp | 1/4 cup |
| 12/2/2010 | 5 1/2 inches | Green | 1 tsp | 1/4 cup |
| 12/3/2010 | 5 1/2 inches | Green | 1 tsp | 1/4 cup |
| 12/4/2010 | 5 1/2 inches | Turning Brown | 1 tsp | 1/4 cup |
| 12/5/2010 | 5 1/2 inches | Turning Brown | 1 tsp | 1/4 cup |
| 12/6/2010 | 5 3/4 inches | Turning Brown | 1 tsp | 1/4 cup |
| 12/7/2010 | 5 3/4 inches | Turning Brown | 1 tsp | 1/4 cup |
| 12/8/2010 | 5 3/4 inches | Brown | 1 tsp | 1/4 cup |
| 12/9/2010 | 5 3/4 inches | Brown | 1 tsp | 1/4 cup |
| 12/10/2010 | 6 inches | Brown | 1 tsp | 1/4 cup |
| 12/11/2010 | 6 inches | Brown | 1 tsp | 1/4 cup |
| 12/12/2010 | 6 inches | Brown | 1 tsp | 1/4 cup |
| 12/13/2010 | 6 inches | Brown | 1 tsp | 1/4 cup |
| 12/14/2010 | 6 inches | Brown | 1 tsp | 1/4 cup |
| 12/15/2010 | 6 inches | Brown/Wilting | 1 tsp | 1/4 cup |
| 12/15/2010 | 6 1/4 inches | Brown/Wilting | 1 tsp | 1/4 cup |
| 12/16/2010 | 6 1/4 inches | Brown/Wilting | 1 tsp | 1/4 cup |
| 12/17/2010 | 6 1/4 inches | Brown/Wilting | 1 tsp | 1/4 cup |
| 12/18/2010 | 6 1/4 inches | Brown/Wilting | 1 tsp | 1/4 cup |
| 12/19/2010 | 6 1/4 inches | Brown/Wilting | 1 tsp | 1/4 cup |
| 12/20/2010 | 6 1/2 inches | Brown/Wilting | 1 tsp | 1/4 cup |
| 12/21/2010 | 6 1/2 inches | Brown/Wilting | 1 tsp | 1/4 cup |
| 12/22/2010 | 6 1/2 inches | Brown/Wilting | 1 tsp | 1/4 cup |
Analysis
The interpretation of the data collected during the experiment is that: The more salt that is exposed to the plants roots, the more the salt dehydrates the plants, therefore causing the plants to die, though most gardeners water their plants with regular tap water, the plant that was the control was watered with no salt water, yet it still wilted.
Conclusions
This experiment showed that watering plants with any amount of salt water inhibits the growth and life of a plant by dehydrating it. The hypothesis did support the experiment, as predicted, the control plant did live the longest, and the plant with the most salt intake was the first to wilt.

References
Education.com provides the Science Fair Project Ideas for informational purposes only. Education.com does not make any guarantee or representation regarding the Science Fair Project Ideas and is not responsible or liable for any loss or damage, directly or indirectly, caused by your use of such information. By accessing the Science Fair Project Ideas, you waive and renounce any claims against Education.com that arise thereof. In addition, your access to Education.com's website and Science Fair Project Ideas is covered by Education.com's Privacy Policy and site Terms of Use, which include limitations on Education.com's liability.
Warning is hereby given that not all Project Ideas are appropriate for all individuals or in all circumstances. Implementation of any Science Project Idea should be undertaken only in appropriate settings and with appropriate parental or other supervision. Reading and following the safety precautions of all materials used in a project is the sole responsibility of each individual. For further information, consult your state's handbook of Science Safety.
Related learning resources