SKIP TO CONTENT
Worksheet Generator
Subjects
Grades
Worksheets
Games
Build a Worksheet
More Resources
Roly Recommends
Subjects
Grades
Worksheets
Games
Build a Worksheet
More Resources
Roly Recommends
All Subjects
Math
Data and Graphing
Subtopics:
Collecting and Organizing Data
Bar Graphs
Show Less
Filters
Search for: pdf, skeleton, model, template
✕
Math
✕
Elementary School
✕
Subjects
Math
English Language Arts
Science
Social Studies
Foreign Language
Grade Level
Pre-K
K
1st
2nd
3rd
4th
5th
6th
7th
8th
Early Childhood
Elementary School
Middle School
Resource Type
Worksheets
Lesson Plans
Activities
Common Core
Yes
Arts & Crafts
Arts & Crafts
Paper & Glue Crafts
English Language Support
Yes
See More
Clear All
View 15 results
Showing Results for pdf skeleton model template
15 results
Search for: pdf, skeleton, model, template
✕
Math
✕
Elementary School
✕
Clear All
Sort by:
Relevance
Most recent
Most popular
Alphabetical A-Z
Alphabetical Z-A
All filters
15 results
Sort by:
Relevance
Most recent
Most popular
Alphabetical A-Z
Alphabetical Z-A
Create a Line Plot (With Your Own Data!)
Worksheet
Create a Line Plot (With Your Own Data!)
Second Grade
Data and Graphing
Invite students to become researchers with this open-ended line plot template!
Worksheet
Create a Line Plot (With Your Own Data!)
Worksheet
Create a Line Plot (With Your Own Data!)
Invite students to become researchers with this open-ended line plot template!
Second Grade
Data and Graphing
Worksheet
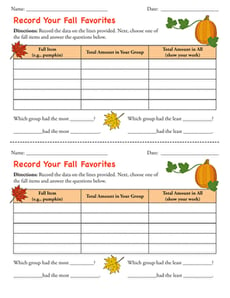
Record Your Fall Favorites
Worksheet
Record Your Fall Favorites
Second Grade
Data and Graphing
Use this template alongside the engaging lesson, “Let’s Graph Our Fall Favorites” to support kids in interpreting data.
Worksheet
Record Your Fall Favorites
Worksheet
Record Your Fall Favorites
Use this template alongside the engaging lesson, “Let’s Graph Our Fall Favorites” to support kids in interpreting data.
Second Grade
Data and Graphing
Worksheet
EL
Nature Counting
Lesson Plan
Nature Counting
Kindergarten
Data and Graphing
Use this fun lesson plan to introduce or review the concept of addition to your ELs. Can be used as a stand alone or support lesson for the
Nature and Counting It All Adds Up
lesson plan.
Lesson Plan
EL
Nature Counting
Lesson Plan
Nature Counting
Use this fun lesson plan to introduce or review the concept of addition to your ELs. Can be used as a stand alone or support lesson for the
Nature and Counting It All Adds Up
lesson plan.
Kindergarten
Data and Graphing
Lesson Plan
Graph My Design
Worksheet
Graph My Design
First Grade
Data and Graphing
Students build a design and then use this bar graph to show how many of each shape was used. Place inside a sheet protector to reuse.
Worksheet
Graph My Design
Worksheet
Graph My Design
Students build a design and then use this bar graph to show how many of each shape was used. Place inside a sheet protector to reuse.
First Grade
Data and Graphing
Worksheet
Plant a Flower Garden
Worksheet
Plant a Flower Garden
Kindergarten
Data and Graphing
Plant a paper flower garden with this fun sorting activity! Children color the flowers, then cut them out and sort them by type.
Worksheet
Plant a Flower Garden
Worksheet
Plant a Flower Garden
Plant a paper flower garden with this fun sorting activity! Children color the flowers, then cut them out and sort them by type.
Kindergarten
Data and Graphing
Worksheet
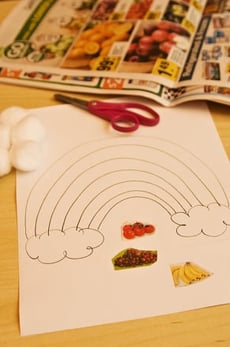
Create a Rainbow of Healthy Food
Activity
Create a Rainbow of Healthy Food
Pre-K
Data and Graphing
Help your preschooler chart her good eating habits with this arts and crafts activity that has her making a healthy fruits and vegetables rainbow and graph!
Activity
Create a Rainbow of Healthy Food
Activity
Create a Rainbow of Healthy Food
Help your preschooler chart her good eating habits with this arts and crafts activity that has her making a healthy fruits and vegetables rainbow and graph!
Pre-K
Data and Graphing
Activity
Graphing Colored Counters
Lesson Plan
Graphing Colored Counters
Kindergarten
Data and Graphing
In this lesson, your students will use the background knowledge that they have about counting and sorting to graph data. They will practice answering questions about the graph!
Lesson Plan
Graphing Colored Counters
Lesson Plan
Graphing Colored Counters
In this lesson, your students will use the background knowledge that they have about counting and sorting to graph data. They will practice answering questions about the graph!
Kindergarten
Data and Graphing
Lesson Plan
Mighty Mean, Median, and Mode
Lesson Plan
Mighty Mean, Median, and Mode
Fourth Grade
Data and Graphing
Give your students a good basis in interpreting data with this lesson that teaches them about mean, median, and mode with plenty of practice and cute videos to keep them interested.
Lesson Plan
Mighty Mean, Median, and Mode
Lesson Plan
Mighty Mean, Median, and Mode
Give your students a good basis in interpreting data with this lesson that teaches them about mean, median, and mode with plenty of practice and cute videos to keep them interested.
Fourth Grade
Data and Graphing
Lesson Plan
EL
Graph My Design
Lesson Plan
Graph My Design
First Grade
Geometry
Geometry meets data in this fun lesson! Students will build a design using pattern blocks and then graph the number of each shape used. This scaffolded EL lesson can be used alone or alongside
Graphing Colored Counters.
Lesson Plan
EL
Graph My Design
Lesson Plan
Graph My Design
Geometry meets data in this fun lesson! Students will build a design using pattern blocks and then graph the number of each shape used. This scaffolded EL lesson can be used alone or alongside
Graphing Colored Counters.
First Grade
Geometry
Lesson Plan
What Doesn't Belong? A Categorization Game
Activity
What Doesn't Belong? A Categorization Game
Third Grade
Data and Graphing
This educated-guessing game is great for preschoolers. This activity helps your child work on her reasoning skills.
Activity
What Doesn't Belong? A Categorization Game
Activity
What Doesn't Belong? A Categorization Game
This educated-guessing game is great for preschoolers. This activity helps your child work on her reasoning skills.
Third Grade
Data and Graphing
Activity
Olympic Math: Mean, Median and Mode Review
Lesson Plan
Olympic Math: Mean, Median and Mode Review
Fifth Grade
Data and Graphing
Help your students win gold with this lesson that gives them plenty of practice with mode, median, and mean.
Lesson Plan
Olympic Math: Mean, Median and Mode Review
Lesson Plan
Olympic Math: Mean, Median and Mode Review
Help your students win gold with this lesson that gives them plenty of practice with mode, median, and mean.
Fifth Grade
Data and Graphing
Lesson Plan
Household Energy Consumption
Activity
Household Energy Consumption
Third Grade
Multiplication
Challenge your third-grader to sharpen her new math skills--and maybe do the planet a favor, too.
Activity
Household Energy Consumption
Activity
Household Energy Consumption
Challenge your third-grader to sharpen her new math skills--and maybe do the planet a favor, too.
Third Grade
Multiplication
Activity
Let's Graph Our Fall Favorites!
Lesson Plan
Let's Graph Our Fall Favorites!
Second Grade
Data and Graphing
This engaging math lesson combines all of your kid's fall favorites as they learn to represent data using a bar graph.
Lesson Plan
Let's Graph Our Fall Favorites!
Lesson Plan
Let's Graph Our Fall Favorites!
This engaging math lesson combines all of your kid's fall favorites as they learn to represent data using a bar graph.
Second Grade
Data and Graphing
Lesson Plan
Math + Love = Valentine's Day Bar Graph
Lesson Plan
Math + Love = Valentine's Day Bar Graph
Second Grade
Data and Graphing
What's more romantic than a bar graph on Valentine's Day? In this Valentine's Day lesson plan, students will use information from a data set to create their own tally charts and bar graphs and then analyze these graphs to answer questions.
Lesson Plan
Math + Love = Valentine's Day Bar Graph
Lesson Plan
Math + Love = Valentine's Day Bar Graph
What's more romantic than a bar graph on Valentine's Day? In this Valentine's Day lesson plan, students will use information from a data set to create their own tally charts and bar graphs and then analyze these graphs to answer questions.
Second Grade
Data and Graphing
Lesson Plan
What is it Telling Me? Creating and Interpreting Line Plots
Lesson Plan
What is it Telling Me? Creating and Interpreting Line Plots
Third Grade
Data and Graphing
Line plots are a great way to introduce your students to graphing data. In this lesson, your students will learn how to create a line plot and also practice interpreting line plots.
Lesson Plan
What is it Telling Me? Creating and Interpreting Line Plots
Lesson Plan
What is it Telling Me? Creating and Interpreting Line Plots
Line plots are a great way to introduce your students to graphing data. In this lesson, your students will learn how to create a line plot and also practice interpreting line plots.
Third Grade
Data and Graphing
Lesson Plan
1