SKIP TO CONTENT
Worksheet Generator
Subjects
Grades
Worksheets
Games
Build a Worksheet
More Resources
Roly Recommends
Subjects
Grades
Worksheets
Games
Build a Worksheet
More Resources
Roly Recommends
All Subjects
Math
Data and Graphing
Subtopics:
Collecting and Organizing Data
Picture Graphs
Bar Graphs
Line Plots
Coordinate Plane
Show Less
Filters
Search for: in
✕
Math
✕
1st - 4th Grade
✕
Subjects
Math
English Language Arts
Science
Social Studies
Foreign Language
Grade Level
Pre-K
K
1st
2nd
3rd
4th
5th
6th
7th
8th
Early Childhood
Elementary School
Middle School
Resource Type
Worksheets
Games
Lesson Plans
Interactive Worksheets
Workbooks
Activities
Exercises
Offline Games
Guided Lessons
Occasion
Birthdays
St. Patrick's Day
Summer
Back to School
Halloween
Winter
Holidays
Hanukkah
Valentine's Day
Common Core
Yes
Game Type
Ball Games
Arts & Crafts
Arts & Crafts
Paper & Glue Crafts
English Language Support
Yes
See More
Clear All
View 162 results
Showing Results for in : Page 3
162 results
Search for: in
✕
Math
✕
1st - 4th Grade
✕
Clear All
Sort by:
Relevance
Most recent
Most popular
Alphabetical A-Z
Alphabetical Z-A
All filters
162 results
Sort by:
Relevance
Most recent
Most popular
Alphabetical A-Z
Alphabetical Z-A
Ice Cream Bar Graph #5
Worksheet
Ice Cream Bar Graph #5
First Grade
Data and Graphing
Can you help Sam, Kate, and Becky keep track of ice cream sales? Get some practice with bar graphs, addition and subtraction all in one worksheet!
Worksheet
Ice Cream Bar Graph #5
Worksheet
Ice Cream Bar Graph #5
Can you help Sam, Kate, and Becky keep track of ice cream sales? Get some practice with bar graphs, addition and subtraction all in one worksheet!
First Grade
Data and Graphing
Worksheet
Graphing Data: Colors
Worksheet
Graphing Data: Colors
Second Grade
Data and Graphing
Help the concept of graphing really sink in by challenging your second grader to graph kids' favorite colors using a table, tally mark table, and grid.
Worksheet
Graphing Data: Colors
Worksheet
Graphing Data: Colors
Help the concept of graphing really sink in by challenging your second grader to graph kids' favorite colors using a table, tally mark table, and grid.
Second Grade
Data and Graphing
Worksheet
Ice Cream Bar Graph #10
Worksheet
Ice Cream Bar Graph #10
First Grade
Data and Graphing
Sam, Kate, and Becky need help keeping track of their ice cream sales. Practice using bar graphs, addition, and subtraction in this ice cream themed worksheet.
Worksheet
Ice Cream Bar Graph #10
Worksheet
Ice Cream Bar Graph #10
Sam, Kate, and Becky need help keeping track of their ice cream sales. Practice using bar graphs, addition, and subtraction in this ice cream themed worksheet.
First Grade
Data and Graphing
Worksheet
Bar Graphs: Interpreting Data
Lesson Plan
Bar Graphs: Interpreting Data
Second Grade
Data and Graphing
In this lesson, students will make bar graphs and interpret data using real-life data from other students. They will get practice writing and answering survey questions.
Lesson Plan
Bar Graphs: Interpreting Data
Lesson Plan
Bar Graphs: Interpreting Data
In this lesson, students will make bar graphs and interpret data using real-life data from other students. They will get practice writing and answering survey questions.
Second Grade
Data and Graphing
Lesson Plan
Go Runners! Practice Reading a Bar Graph
Worksheet
Go Runners! Practice Reading a Bar Graph
Third Grade
Data and Graphing
Your child will practice reading and interpreting a bar graph and using its data to answer a set of questions in this 3rd grade math worksheet.
Worksheet
Go Runners! Practice Reading a Bar Graph
Worksheet
Go Runners! Practice Reading a Bar Graph
Your child will practice reading and interpreting a bar graph and using its data to answer a set of questions in this 3rd grade math worksheet.
Third Grade
Data and Graphing
Worksheet
Juice Time: Practice Reading a Bar Graph
Worksheet
Juice Time: Practice Reading a Bar Graph
Third Grade
Data and Graphing
In this 3rd grade math worksheet, your child will practice reading a bar graph about juice and interpreting its information to answer a set of questions.
Worksheet
Juice Time: Practice Reading a Bar Graph
Worksheet
Juice Time: Practice Reading a Bar Graph
In this 3rd grade math worksheet, your child will practice reading a bar graph about juice and interpreting its information to answer a set of questions.
Third Grade
Data and Graphing
Worksheet
Write Problem Questions for Line Plots
Worksheet
Write Problem Questions for Line Plots
Third Grade
Data and Graphing
Give your students the opportunity to think critically as a mathematician. In this exercise, they will analyze a line plot and create questions about the data.
Worksheet
Write Problem Questions for Line Plots
Worksheet
Write Problem Questions for Line Plots
Give your students the opportunity to think critically as a mathematician. In this exercise, they will analyze a line plot and create questions about the data.
Third Grade
Data and Graphing
Worksheet
Zap and Kreb: Graphing Word Problems
Game
Zap and Kreb: Graphing Word Problems
Third Grade
Data and Graphing
Kids journey to Earth with aliens Zap and Kreb on a mission to gather data and create graphs in a math story that's out of this world!
Game
Zap and Kreb: Graphing Word Problems
Game
Zap and Kreb: Graphing Word Problems
Kids journey to Earth with aliens Zap and Kreb on a mission to gather data and create graphs in a math story that's out of this world!
Third Grade
Data and Graphing
Game
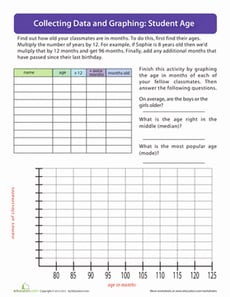
Student Age
Worksheet
Student Age
Third Grade
Data and Graphing
Get to know your classmates with a fun polling and graphing activity. Kids will use their math skills to find the ages of their classmates in months.
Worksheet
Student Age
Worksheet
Student Age
Get to know your classmates with a fun polling and graphing activity. Kids will use their math skills to find the ages of their classmates in months.
Third Grade
Data and Graphing
Worksheet
Pictographs: Say Cheese!
Worksheet
Pictographs: Say Cheese!
Third Grade
Data and Graphing
To keep track of his cheese sales, Giovanni uses a pictograph. Kids will figure out how his cheese business is doing by using data in the graph.
Worksheet
Pictographs: Say Cheese!
Worksheet
Pictographs: Say Cheese!
To keep track of his cheese sales, Giovanni uses a pictograph. Kids will figure out how his cheese business is doing by using data in the graph.
Third Grade
Data and Graphing
Worksheet
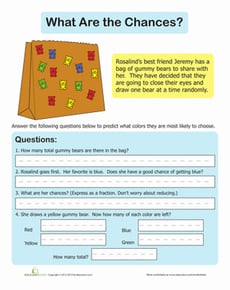
Probability Introduction
Worksheet
Probability Introduction
Third Grade
Data and Graphing
What are the odds? Kids will learn about the important concept of probability by counting gummy bears in a bag. Which color is most likely to be picked?
Worksheet
Probability Introduction
Worksheet
Probability Introduction
What are the odds? Kids will learn about the important concept of probability by counting gummy bears in a bag. Which color is most likely to be picked?
Third Grade
Data and Graphing
Worksheet
Graphing Colored Counters
Lesson Plan
Graphing Colored Counters
Kindergarten
Data and Graphing
In this lesson, your students will use the background knowledge that they have about counting and sorting to graph data. They will practice answering questions about the graph!
Lesson Plan
Graphing Colored Counters
Lesson Plan
Graphing Colored Counters
In this lesson, your students will use the background knowledge that they have about counting and sorting to graph data. They will practice answering questions about the graph!
Kindergarten
Data and Graphing
Lesson Plan
X Y Coordinates
Worksheet
X Y Coordinates
Fourth Grade
Data and Graphing
Your child will practice working with x y coordinates and use their critical thinking skills in this fun math printable.
Worksheet
X Y Coordinates
Worksheet
X Y Coordinates
Your child will practice working with x y coordinates and use their critical thinking skills in this fun math printable.
Fourth Grade
Data and Graphing
Worksheet
Reading Pictographs: Drink Your Milk!
Worksheet
Reading Pictographs: Drink Your Milk!
Third Grade
Data and Graphing
Can your child help Tommy figure out how much milk he drinks? As she does, she'll learn how to read and interpret data in graphs and practice multiplication.
Worksheet
Reading Pictographs: Drink Your Milk!
Worksheet
Reading Pictographs: Drink Your Milk!
Can your child help Tommy figure out how much milk he drinks? As she does, she'll learn how to read and interpret data in graphs and practice multiplication.
Third Grade
Data and Graphing
Worksheet
Ice Cream Graph #16
Worksheet
Ice Cream Graph #16
First Grade
Data and Graphing
Sam, Kate and Becky are having an ice cream sale. Help them keep track of their sales by drawing in a pictograph, and then answer a few math questions.
Worksheet
Ice Cream Graph #16
Worksheet
Ice Cream Graph #16
Sam, Kate and Becky are having an ice cream sale. Help them keep track of their sales by drawing in a pictograph, and then answer a few math questions.
First Grade
Data and Graphing
Worksheet
Pool Toys Pie Chart
Worksheet
Pool Toys Pie Chart
Second Grade
Data and Graphing
Sue found out people's favorite pool toys and posted her results in a pie chart. Students practice their analytical skills by coming up their own questions.
Worksheet
Pool Toys Pie Chart
Worksheet
Pool Toys Pie Chart
Sue found out people's favorite pool toys and posted her results in a pie chart. Students practice their analytical skills by coming up their own questions.
Second Grade
Data and Graphing
Worksheet
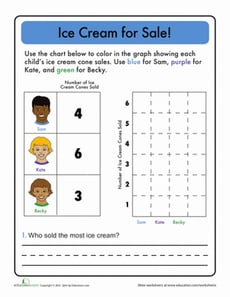
Bar Graph Worksheet
Worksheet
Bar Graph Worksheet
First Grade
Data and Graphing
Sam, Kate and Becky are having an ice cream sale. Help them keep track of their sales by filling in a bar graph, and then answer a few questions.
Worksheet
Bar Graph Worksheet
Worksheet
Bar Graph Worksheet
Sam, Kate and Becky are having an ice cream sale. Help them keep track of their sales by filling in a bar graph, and then answer a few questions.
First Grade
Data and Graphing
Worksheet
Tally Chart: At the Sushi Counter
Worksheet
Tally Chart: At the Sushi Counter
First Grade
Data and Graphing
The chef made a lot of sushi today during lunch. Can your child help him figure out how much sushi he made by filling in the table with tally marks?
Worksheet
Tally Chart: At the Sushi Counter
Worksheet
Tally Chart: At the Sushi Counter
The chef made a lot of sushi today during lunch. Can your child help him figure out how much sushi he made by filling in the table with tally marks?
First Grade
Data and Graphing
Worksheet
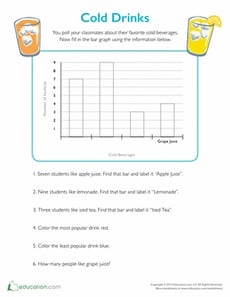
Cold Drinks Bar Graph
Worksheet
Cold Drinks Bar Graph
Second Grade
Data and Graphing
Use an easy bar graph to find out what your classmates' favorite cold drinks are. Kids will get the chance to analyze data and color in the bar graph.
Worksheet
Cold Drinks Bar Graph
Worksheet
Cold Drinks Bar Graph
Use an easy bar graph to find out what your classmates' favorite cold drinks are. Kids will get the chance to analyze data and color in the bar graph.
Second Grade
Data and Graphing
Worksheet
Data and Graphing
Workbook
Data and Graphing
Third Grade
Data and Graphing
Become a master of analysis! In this series, kids practice collecting, creating and plotting data on graphs. Then they'll practice reading graphs, making predictions, and comparing data.
Workbook
Data and Graphing
Workbook
Data and Graphing
Become a master of analysis! In this series, kids practice collecting, creating and plotting data on graphs. Then they'll practice reading graphs, making predictions, and comparing data.
Third Grade
Data and Graphing
Workbook
Ice Cream Bar Graph #6
Worksheet
Ice Cream Bar Graph #6
First Grade
Data and Graphing
Sam, Kate and Becky are having an ice cream sale. Help them keep track of their sales by filling in a bar graph, and then answer a few math questions.
Worksheet
Ice Cream Bar Graph #6
Worksheet
Ice Cream Bar Graph #6
Sam, Kate and Becky are having an ice cream sale. Help them keep track of their sales by filling in a bar graph, and then answer a few math questions.
First Grade
Data and Graphing
Worksheet
Ice Cream Graph #11
Worksheet
Ice Cream Graph #11
First Grade
Data and Graphing
Sam, Kate and Becky are having an ice cream sale. Help them keep track of their sales by filling in a pictograph, and then answer a few math questions.
Worksheet
Ice Cream Graph #11
Worksheet
Ice Cream Graph #11
Sam, Kate and Becky are having an ice cream sale. Help them keep track of their sales by filling in a pictograph, and then answer a few math questions.
First Grade
Data and Graphing
Worksheet
What Do We Know About Vegetables?
Worksheet
What Do We Know About Vegetables?
First Grade
Data and Graphing
This math worksheet asks students to problem solve using data. Students will satisfy their math appetite by counting, adding, and problem solving using the vegetable data in a bar graph.
Worksheet
What Do We Know About Vegetables?
Worksheet
What Do We Know About Vegetables?
This math worksheet asks students to problem solve using data. Students will satisfy their math appetite by counting, adding, and problem solving using the vegetable data in a bar graph.
First Grade
Data and Graphing
Worksheet
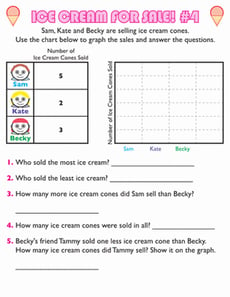
Ice Cream Bar Graph #4
Worksheet
Ice Cream Bar Graph #4
First Grade
Data and Graphing
Ice cream sellers Sam, Kate, and Becky need your kid's help to keep track of their sales. Get your kid to use graphing and analysis skills in this worksheet.
Worksheet
Ice Cream Bar Graph #4
Worksheet
Ice Cream Bar Graph #4
Ice cream sellers Sam, Kate, and Becky need your kid's help to keep track of their sales. Get your kid to use graphing and analysis skills in this worksheet.
First Grade
Data and Graphing
Worksheet
What is it Telling Me? Creating and Interpreting Line Plots
Lesson Plan
What is it Telling Me? Creating and Interpreting Line Plots
Third Grade
Data and Graphing
Line plots are a great way to introduce your students to graphing data. In this lesson, your students will learn how to create a line plot and also practice interpreting line plots.
Lesson Plan
What is it Telling Me? Creating and Interpreting Line Plots
Lesson Plan
What is it Telling Me? Creating and Interpreting Line Plots
Line plots are a great way to introduce your students to graphing data. In this lesson, your students will learn how to create a line plot and also practice interpreting line plots.
Third Grade
Data and Graphing
Lesson Plan
Mighty Mean, Median, and Mode
Lesson Plan
Mighty Mean, Median, and Mode
Fourth Grade
Data and Graphing
Give your students a good basis in interpreting data with this lesson that teaches them about mean, median, and mode with plenty of practice and cute videos to keep them interested.
Lesson Plan
Mighty Mean, Median, and Mode
Lesson Plan
Mighty Mean, Median, and Mode
Give your students a good basis in interpreting data with this lesson that teaches them about mean, median, and mode with plenty of practice and cute videos to keep them interested.
Fourth Grade
Data and Graphing
Lesson Plan
Create a Family Graph!
Activity
Create a Family Graph!
Third Grade
Data and Graphing
Create a graph based on the interests of family member's to see who has what in common. Your child will practice her math skills and get to know the family!
Activity
Create a Family Graph!
Activity
Create a Family Graph!
Create a graph based on the interests of family member's to see who has what in common. Your child will practice her math skills and get to know the family!
Third Grade
Data and Graphing
Activity
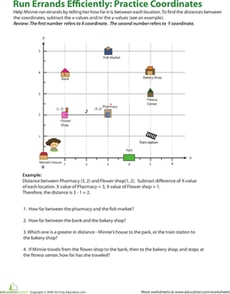
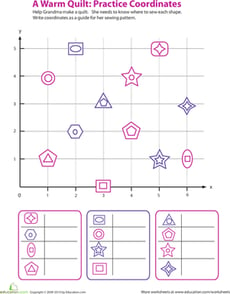
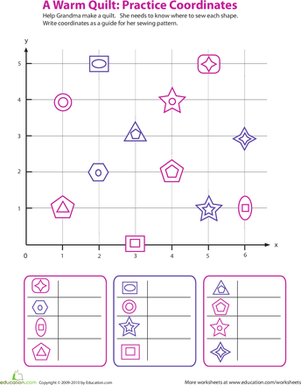
A Warm Quilt: Practice Coordinates
Worksheet
A Warm Quilt: Practice Coordinates
Fourth Grade
Data and Graphing
Your fourth grader will be kept occupied and entertained with this fun math printable. He will be practicing pre-algebra and coordinates in no time!
Worksheet
A Warm Quilt: Practice Coordinates
Worksheet
A Warm Quilt: Practice Coordinates
Your fourth grader will be kept occupied and entertained with this fun math printable. He will be practicing pre-algebra and coordinates in no time!
Fourth Grade
Data and Graphing
Worksheet
Probability Game
Activity
Probability Game
Third Grade
Data and Graphing
Probability can be a tough concept to master. Try playing this fun card game in order to help your third grader understand it a little better.
Activity
Probability Game
Activity
Probability Game
Probability can be a tough concept to master. Try playing this fun card game in order to help your third grader understand it a little better.
Third Grade
Data and Graphing
Activity
Graph My Design
Lesson Plan
Graph My Design
First Grade
Geometry
Geometry meets data in this fun lesson! Students will build a design using pattern blocks and then graph the number of each shape used. This scaffolded EL lesson can be used alone or alongside
Graphing Colored Counters.
Lesson Plan
Graph My Design
Lesson Plan
Graph My Design
Geometry meets data in this fun lesson! Students will build a design using pattern blocks and then graph the number of each shape used. This scaffolded EL lesson can be used alone or alongside
Graphing Colored Counters.
First Grade
Geometry
Lesson Plan
1
2
3
4
5
6