SKIP TO CONTENT
Worksheet Generator
Subjects
Grades
Worksheets
Games
Build a Worksheet
More Resources
Roly Recommends
Summer Boost
Subjects
Grades
Worksheets
Games
Build a Worksheet
More Resources
Roly Recommends
Summer Boost
Showing Results for in
Filters
Math
Data and Graphing
56 results
Search for: in
✕
Math
✕
3rd Grade
✕
Clear all
56 results
Subtopics:
Collecting and Organizing Data
Picture Graphs
Bar Graphs
Line Plots
Show Less
Filters
Search for: in
✕
Math
✕
3rd Grade
✕
Subjects
Math
English Language Arts
Science
Social Studies
Foreign Language
Technology
Grade Level
Pre-K
K
1st
2nd
3rd
4th
5th
6th
7th
8th
Early Childhood
Elementary School
Middle School
Resource Type
Worksheets
Games
Lesson Plans
Interactive Worksheets
Workbooks
Activities
Exercises
Offline Games
Guided Lessons
Occasion
Birthdays
Back to School
Halloween
Holidays
Common Core
Yes
English Language Support
Yes
Clear all
View 56 results
Showing Results for in
Filters
56 results
Search for: in
✕
Math
✕
3rd Grade
✕
Clear all
56 results
Scaled Bar Graphs in Space
Game
Scaled Bar Graphs in Space
Third Grade
Data and Graphing
Out of this world! Kids help Roly collect, sort, and graph random objects in this silly space game.
Game
Scaled Bar Graphs in Space
Game
Scaled Bar Graphs in Space
Out of this world! Kids help Roly collect, sort, and graph random objects in this silly space game.
Third Grade
Data and Graphing
Game
Comparing Pictographs: Taxi, Taxi
Worksheet
Comparing Pictographs: Taxi, Taxi
Third Grade
Addition
In this 3rd grade math worksheet, kids analyze and compare data in two pictographs in order to answer a set of word problems.
Worksheet
Comparing Pictographs: Taxi, Taxi
Worksheet
Comparing Pictographs: Taxi, Taxi
In this 3rd grade math worksheet, kids analyze and compare data in two pictographs in order to answer a set of word problems.
Third Grade
Addition
Worksheet
Reading Pictographs: Building a New Town
Worksheet
Reading Pictographs: Building a New Town
Third Grade
Data and Graphing
In this 3rd grade math worksheet, kids practice interpreting graph data and using information in a pictograph to answer word problems.
Worksheet
Reading Pictographs: Building a New Town
Worksheet
Reading Pictographs: Building a New Town
In this 3rd grade math worksheet, kids practice interpreting graph data and using information in a pictograph to answer word problems.
Third Grade
Data and Graphing
Worksheet
Reading Pictographs: Carrots for Bunnies
Worksheet
Reading Pictographs: Carrots for Bunnies
Third Grade
Data and Graphing
How many carrots did Sammy's pet bunny eat? Kids use information in the pictograph to answer word problems in this bunny-filled math worksheet.
Worksheet
Reading Pictographs: Carrots for Bunnies
Worksheet
Reading Pictographs: Carrots for Bunnies
How many carrots did Sammy's pet bunny eat? Kids use information in the pictograph to answer word problems in this bunny-filled math worksheet.
Third Grade
Data and Graphing
Worksheet
Reading Pictographs: Eggplant Cooking
Worksheet
Reading Pictographs: Eggplant Cooking
Third Grade
Data and Graphing
Mr. Chef keeps track of how many eggplants he uses with a pictograph. In this worksheet, kids use information in the pictograph to answer word problems.
Worksheet
Reading Pictographs: Eggplant Cooking
Worksheet
Reading Pictographs: Eggplant Cooking
Mr. Chef keeps track of how many eggplants he uses with a pictograph. In this worksheet, kids use information in the pictograph to answer word problems.
Third Grade
Data and Graphing
Worksheet
Reading Pictographs: Going to the Theater
Worksheet
Reading Pictographs: Going to the Theater
Third Grade
Data and Graphing
In this 3rd grade math worksheet, kids practice interpreting graph data as they use the information in a pictograph to answer a set of questions.
Worksheet
Reading Pictographs: Going to the Theater
Worksheet
Reading Pictographs: Going to the Theater
In this 3rd grade math worksheet, kids practice interpreting graph data as they use the information in a pictograph to answer a set of questions.
Third Grade
Data and Graphing
Worksheet
Reading a Bar Graph: Number of Athletes
Worksheet
Reading a Bar Graph: Number of Athletes
Third Grade
Data and Graphing
In this sports-themed worksheet, children use a bar graph to answer six questions about the number of athletes playing at a time in a variety of sporting events.
Worksheet
Reading a Bar Graph: Number of Athletes
Worksheet
Reading a Bar Graph: Number of Athletes
In this sports-themed worksheet, children use a bar graph to answer six questions about the number of athletes playing at a time in a variety of sporting events.
Third Grade
Data and Graphing
Worksheet
Creating Data
Worksheet
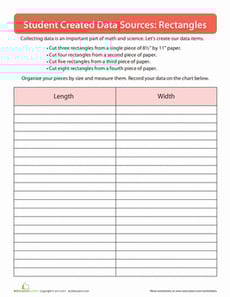
Creating Data
Third Grade
Measurement
Practice creating your own data sources in this introductory graphing activity.
Worksheet
Creating Data
Worksheet
Creating Data
Practice creating your own data sources in this introductory graphing activity.
Third Grade
Measurement
Worksheet
Picture Graphing with Fish
Game
Picture Graphing with Fish
Third Grade
Data and Graphing
Fish, fish everywhere! Kids catch fish to sort and graph in this zany game.
Game
Picture Graphing with Fish
Game
Picture Graphing with Fish
Fish, fish everywhere! Kids catch fish to sort and graph in this zany game.
Third Grade
Data and Graphing
Game
Interpret the Line Plot
Worksheet
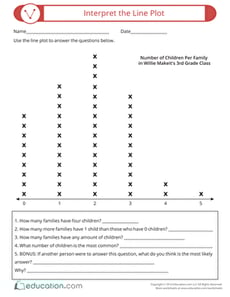
Interpret the Line Plot
Second Grade
Data and Graphing
Students will get important practice analyzing line plots in this graphing and data worksheet.
Worksheet
Interpret the Line Plot
Worksheet
Interpret the Line Plot
Students will get important practice analyzing line plots in this graphing and data worksheet.
Second Grade
Data and Graphing
Worksheet
Interpreting Line Plots with Fractional Units
Worksheet
Interpreting Line Plots with Fractional Units
Third Grade
Data and Graphing
In this third grade worksheet, kids will interpret a line plot that includes fractional units.
Worksheet
Interpreting Line Plots with Fractional Units
Worksheet
Interpreting Line Plots with Fractional Units
In this third grade worksheet, kids will interpret a line plot that includes fractional units.
Third Grade
Data and Graphing
Worksheet
Data 1
Guided Lesson
Data 1
Third Grade
Fractions
Learning how to represent numerical information is a key part of the third grade math curriculum. This lesson in data provides guided instruction designed by our team of curriculum experts and teachers to present this concept in an engaging way. Not only that, but helpful exercises help kids to see the practical applicaton of these skills in the real world.
Guided Lesson
Data 1
Guided Lesson
Data 1
Learning how to represent numerical information is a key part of the third grade math curriculum. This lesson in data provides guided instruction designed by our team of curriculum experts and teachers to present this concept in an engaging way. Not only that, but helpful exercises help kids to see the practical applicaton of these skills in the real world.
Third Grade
Fractions
Guided Lesson
Scaled Bar Graphs
Exercise
Scaled Bar Graphs
Third Grade
Data and Graphing
This exercise will clarify just how scaled bar graphs represent data found in math problems.
Exercise
Scaled Bar Graphs
Exercise
Scaled Bar Graphs
This exercise will clarify just how scaled bar graphs represent data found in math problems.
Third Grade
Data and Graphing
Exercise
Winter Sports: Practice Reading a Bar Graph
Worksheet
Winter Sports: Practice Reading a Bar Graph
Second Grade
Data and Graphing
Children will practice interpreting a bar graph in this winter sports–themed math worksheet.
Worksheet
Winter Sports: Practice Reading a Bar Graph
Worksheet
Winter Sports: Practice Reading a Bar Graph
Children will practice interpreting a bar graph in this winter sports–themed math worksheet.
Second Grade
Data and Graphing
Worksheet
Mean, Median and Mode Madness!
Lesson Plan
Mean, Median and Mode Madness!
Third Grade
Data and Graphing
This lesson introduces students to the concepts of mean, median, and mode in a hands-on and visual way.
Lesson Plan
Mean, Median and Mode Madness!
Lesson Plan
Mean, Median and Mode Madness!
This lesson introduces students to the concepts of mean, median, and mode in a hands-on and visual way.
Third Grade
Data and Graphing
Lesson Plan
Probability and Statistics 1
Exercise
Probability and Statistics 1
Third Grade
Data and Graphing
This engaging exercise will introduce students to probability and statistics in a way that excites them to continue learning.
Exercise
Probability and Statistics 1
Exercise
Probability and Statistics 1
This engaging exercise will introduce students to probability and statistics in a way that excites them to continue learning.
Third Grade
Data and Graphing
Exercise
Gather Data: Record Your Favorites
Worksheet
Gather Data: Record Your Favorites
Second Grade
Data and Graphing
Use this helpful math worksheet to support children in gathering and organizing data so they can create and interpret graphs.
Worksheet
Gather Data: Record Your Favorites
Worksheet
Gather Data: Record Your Favorites
Use this helpful math worksheet to support children in gathering and organizing data so they can create and interpret graphs.
Second Grade
Data and Graphing
Worksheet
Pitch and Hit Data
Activity
Pitch and Hit Data
Third Grade
Data and Graphing
Okay, engaging in a graphing activity may sound ho-hum, but if you use fun data, it changes the picture entirely.
Activity
Pitch and Hit Data
Activity
Pitch and Hit Data
Okay, engaging in a graphing activity may sound ho-hum, but if you use fun data, it changes the picture entirely.
Third Grade
Data and Graphing
Activity
Stem and Leaf Plot
Worksheet
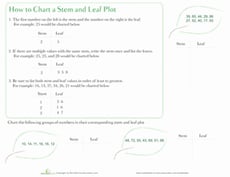
Stem and Leaf Plot
Third Grade
Data and Graphing
Nature is all around you -- even in your math textbooks! Get to the bottom of stem and leaf plots with this helpful worksheet.
Worksheet
Stem and Leaf Plot
Worksheet
Stem and Leaf Plot
Nature is all around you -- even in your math textbooks! Get to the bottom of stem and leaf plots with this helpful worksheet.
Third Grade
Data and Graphing
Worksheet
Comparing Pictographs: Football Time
Worksheet
Comparing Pictographs: Football Time
Third Grade
Data and Graphing
In this math worksheet, kids compare two pictographs that record the number of footballs kicked and the number of footballs thrown on the field.
Worksheet
Comparing Pictographs: Football Time
Worksheet
Comparing Pictographs: Football Time
In this math worksheet, kids compare two pictographs that record the number of footballs kicked and the number of footballs thrown on the field.
Third Grade
Data and Graphing
Worksheet
Football Word Problems
Interactive Worksheet
Football Word Problems
Third Grade
Mixed Operations
Combine a love of football with math in this sports word problem worksheet! Sharpen your 3rd grader's subtraction, addition, and multiplication skills.
Interactive Worksheet
Football Word Problems
Interactive Worksheet
Football Word Problems
Combine a love of football with math in this sports word problem worksheet! Sharpen your 3rd grader's subtraction, addition, and multiplication skills.
Third Grade
Mixed Operations
Interactive Worksheet
Bar Graphing with Roly
Game
Bar Graphing with Roly
Second Grade
Data and Graphing
Stop those germs! Kids must catch germs as they drop and prevent people from getting sick in this icky data and graphing game.
Game
Bar Graphing with Roly
Game
Bar Graphing with Roly
Stop those germs! Kids must catch germs as they drop and prevent people from getting sick in this icky data and graphing game.
Second Grade
Data and Graphing
Game
Reading Pictographs: Tomato Fest!
Worksheet
Reading Pictographs: Tomato Fest!
Third Grade
Data and Graphing
The farmers are busy picking tomatoes! Kids practice reading a pictograph to help Mr. Farmer figure out how many tomatoes he picked in this worksheet.
Worksheet
Reading Pictographs: Tomato Fest!
Worksheet
Reading Pictographs: Tomato Fest!
The farmers are busy picking tomatoes! Kids practice reading a pictograph to help Mr. Farmer figure out how many tomatoes he picked in this worksheet.
Third Grade
Data and Graphing
Worksheet
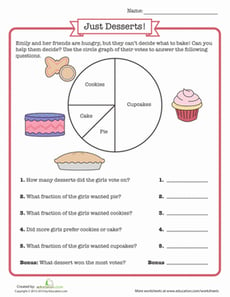
Circle Graph
Worksheet
Circle Graph
Third Grade
Fractions
Tickle your sweet tooth with this graphing worksheet! Your little baker will practice analyzing the data in a circle graph (or pie chart).
Worksheet
Circle Graph
Worksheet
Circle Graph
Tickle your sweet tooth with this graphing worksheet! Your little baker will practice analyzing the data in a circle graph (or pie chart).
Third Grade
Fractions
Worksheet
Bar Graphing with Eggs
Game
Bar Graphing with Eggs
Third Grade
Data and Graphing
It's raining eggs! Kids must move quickly to catch eggs for Farmer Brown, organizing and displaying the data using bar graphs in this silly game.
Game
Bar Graphing with Eggs
Game
Bar Graphing with Eggs
It's raining eggs! Kids must move quickly to catch eggs for Farmer Brown, organizing and displaying the data using bar graphs in this silly game.
Third Grade
Data and Graphing
Game
Comparing Pictographs: Tulips and Daisies
Worksheet
Comparing Pictographs: Tulips and Daisies
Second Grade
Data and Graphing
Your child will use the data in two pictographs that show the number of tulips and daisies imported from certain European countries to answer word problems.
Worksheet
Comparing Pictographs: Tulips and Daisies
Worksheet
Comparing Pictographs: Tulips and Daisies
Your child will use the data in two pictographs that show the number of tulips and daisies imported from certain European countries to answer word problems.
Second Grade
Data and Graphing
Worksheet
Go Runners! Practice Reading a Bar Graph
Worksheet
Go Runners! Practice Reading a Bar Graph
Third Grade
Data and Graphing
Your child will practice reading and interpreting a bar graph and using its data to answer a set of questions in this 3rd grade math worksheet.
Worksheet
Go Runners! Practice Reading a Bar Graph
Worksheet
Go Runners! Practice Reading a Bar Graph
Your child will practice reading and interpreting a bar graph and using its data to answer a set of questions in this 3rd grade math worksheet.
Third Grade
Data and Graphing
Worksheet
Juice Time: Practice Reading a Bar Graph
Worksheet
Juice Time: Practice Reading a Bar Graph
Third Grade
Data and Graphing
In this 3rd grade math worksheet, your child will practice reading a bar graph about juice and interpreting its information to answer a set of questions.
Worksheet
Juice Time: Practice Reading a Bar Graph
Worksheet
Juice Time: Practice Reading a Bar Graph
In this 3rd grade math worksheet, your child will practice reading a bar graph about juice and interpreting its information to answer a set of questions.
Third Grade
Data and Graphing
Worksheet
Write Problem Questions for Line Plots
Worksheet
Write Problem Questions for Line Plots
Third Grade
Data and Graphing
Give your students the opportunity to think critically as a mathematician. In this exercise, they will analyze a line plot and create questions about the data.
Worksheet
Write Problem Questions for Line Plots
Worksheet
Write Problem Questions for Line Plots
Give your students the opportunity to think critically as a mathematician. In this exercise, they will analyze a line plot and create questions about the data.
Third Grade
Data and Graphing
Worksheet
Zap and Kreb: Graphing Word Problems
Game
Zap and Kreb: Graphing Word Problems
Third Grade
Data and Graphing
Kids journey to Earth with aliens Zap and Kreb on a mission to gather data and create graphs in a math story that's out of this world!
Game
Zap and Kreb: Graphing Word Problems
Game
Zap and Kreb: Graphing Word Problems
Kids journey to Earth with aliens Zap and Kreb on a mission to gather data and create graphs in a math story that's out of this world!
Third Grade
Data and Graphing
Game
1
2