SKIP TO CONTENT
Worksheet Generator
Subjects
Grades
Worksheets
Games
Build a Worksheet
More Resources
Roly Recommends
Summer Boost
Subjects
Grades
Worksheets
Games
Build a Worksheet
More Resources
Roly Recommends
Summer Boost
2nd - 7th Grade Data and Graphing Resources : Page 10
Filters
Math
Data and Graphing
318 results
Math
✕
2nd - 7th Grade
✕
Clear All
318 results
Subtopics:
Collecting and Organizing Data
Picture Graphs
Bar Graphs
Line Plots
Coordinate Plane
Box Plots
Histograms
Show Less
Filters
Math
✕
2nd - 7th Grade
✕
Subjects
Math
English Language Arts
Science
Social Studies
Foreign Language
Grade Level
Pre-K
K
1st
2nd
3rd
4th
5th
6th
7th
8th
Early Childhood
Elementary School
Middle School
Resource Type
Worksheets
Games
Lesson Plans
Interactive Worksheets
Workbooks
Activities
Exercises
Offline Games
Guided Lessons
Teacher Resources
Occasion
Birthdays
St. Patrick's Day
Summer
Independence Day
Back to School
Halloween
Winter
Holidays
Christmas
Hanukkah
Valentine's Day
Common Core
Yes
Game Type
Printable Board Games
English Language Support
Yes
See More
Clear All
View 318 results
2nd - 7th Grade Data and Graphing Resources : Page 10
Filters
318 results
Math
✕
2nd - 7th Grade
✕
Clear All
318 results
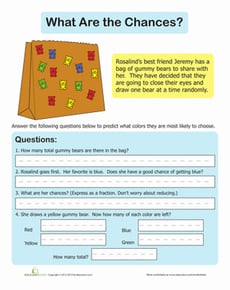
Probability Introduction
Worksheet
Probability Introduction
Third Grade
Data and Graphing
What are the odds? Kids will learn about the important concept of probability by counting gummy bears in a bag. Which color is most likely to be picked?
Worksheet
Probability Introduction
Worksheet
Probability Introduction
What are the odds? Kids will learn about the important concept of probability by counting gummy bears in a bag. Which color is most likely to be picked?
Third Grade
Data and Graphing
Worksheet
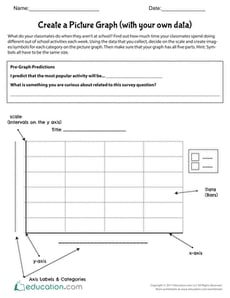
Create a Picture Graph (with your own data)
Worksheet
Create a Picture Graph (with your own data)
Fifth Grade
Data and Graphing
Using data that your students will generate in their class, they will create a picture graph that reflects how much time they spend doing different activities each week.
Worksheet
Create a Picture Graph (with your own data)
Worksheet
Create a Picture Graph (with your own data)
Using data that your students will generate in their class, they will create a picture graph that reflects how much time they spend doing different activities each week.
Fifth Grade
Data and Graphing
Worksheet
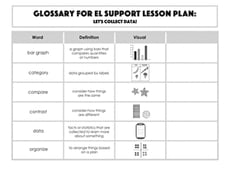
Vocabulary Cards: Let's Collect Data!
Worksheet
Vocabulary Cards: Let's Collect Data!
Second Grade
Data and Graphing
Use these vocabulary cards with the EL Support Lesson Plan: Let's Collect Data!
Worksheet
Vocabulary Cards: Let's Collect Data!
Worksheet
Vocabulary Cards: Let's Collect Data!
Use these vocabulary cards with the EL Support Lesson Plan: Let's Collect Data!
Second Grade
Data and Graphing
Worksheet
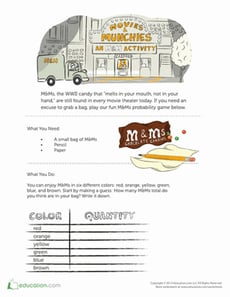
M&Ms Activity
Worksheet
M&Ms Activity
Fifth Grade
Data and Graphing
M&Ms come in six colors and lend themselves perfectly to a game of predictions and probability. Try to guess how many pieces of each color there are in a bag!
Worksheet
M&Ms Activity
Worksheet
M&Ms Activity
M&Ms come in six colors and lend themselves perfectly to a game of predictions and probability. Try to guess how many pieces of each color there are in a bag!
Fifth Grade
Data and Graphing
Worksheet
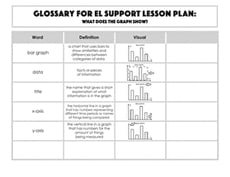
Glossary: What Does the Graph Show?
Worksheet
Glossary: What Does the Graph Show?
Third Grade
Data and Graphing
Glossary: What Does the Graph Show?
Worksheet
Glossary: What Does the Graph Show?
Worksheet
Glossary: What Does the Graph Show?
Glossary: What Does the Graph Show?
Third Grade
Data and Graphing
Worksheet
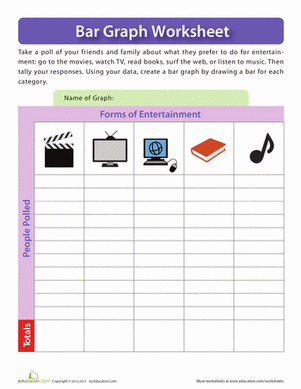
Forms of Entertainment Graph
Worksheet
Forms of Entertainment Graph
Third Grade
Data and Graphing
Poll your friends, family, or classmates to see which kind of entertainment they prefer! This is a fun way for kids to practice collecting data for graphing.
Worksheet
Forms of Entertainment Graph
Worksheet
Forms of Entertainment Graph
Poll your friends, family, or classmates to see which kind of entertainment they prefer! This is a fun way for kids to practice collecting data for graphing.
Third Grade
Data and Graphing
Worksheet
Why Do Leaves Change Color?
Activity
Why Do Leaves Change Color?
Second Grade
Data and Graphing
Engage your children with this fun fall activity that integrates math and science. First, your child will excavate to find leaves. Next, they'll examine them to determine the colors. Then, your child will graph their findings.
Activity
Why Do Leaves Change Color?
Activity
Why Do Leaves Change Color?
Engage your children with this fun fall activity that integrates math and science. First, your child will excavate to find leaves. Next, they'll examine them to determine the colors. Then, your child will graph their findings.
Second Grade
Data and Graphing
Activity
Do a Survey! Favorite Veggies
Worksheet
Do a Survey! Favorite Veggies
Second Grade
Data and Graphing
Give your second grader some practice working with data with this fun-to-complete favorite veggie survey.
Worksheet
Do a Survey! Favorite Veggies
Worksheet
Do a Survey! Favorite Veggies
Give your second grader some practice working with data with this fun-to-complete favorite veggie survey.
Second Grade
Data and Graphing
Worksheet
Glossary: Let's Collect Data!
Worksheet
Glossary: Let's Collect Data!
Second Grade
Data and Graphing
Use this glossary with the EL Support Lesson Plan: Let's Collect Data!
Worksheet
Glossary: Let's Collect Data!
Worksheet
Glossary: Let's Collect Data!
Use this glossary with the EL Support Lesson Plan: Let's Collect Data!
Second Grade
Data and Graphing
Worksheet
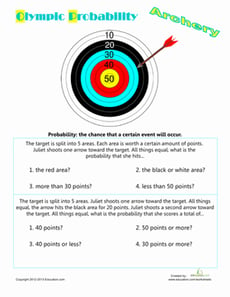
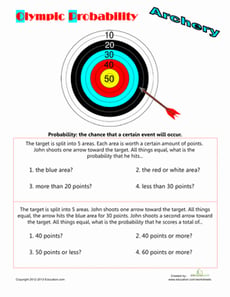
Olympic Probability: Archery
Worksheet
Olympic Probability: Archery
Fifth Grade
Data and Graphing
Take a shot at probability with Olympic archery. Calculate the probability of an arrow hitting a certain color or a particular number of points.
Worksheet
Olympic Probability: Archery
Worksheet
Olympic Probability: Archery
Take a shot at probability with Olympic archery. Calculate the probability of an arrow hitting a certain color or a particular number of points.
Fifth Grade
Data and Graphing
Worksheet
Ski Trail Tracker #8
Worksheet
Ski Trail Tracker #8
Fifth Grade
Data and Graphing
Show your fifth grader how to practice geometry and division sporty style with this fun math worksheet!
Worksheet
Ski Trail Tracker #8
Worksheet
Ski Trail Tracker #8
Show your fifth grader how to practice geometry and division sporty style with this fun math worksheet!
Fifth Grade
Data and Graphing
Worksheet
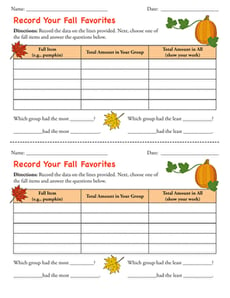
Record Your Fall Favorites
Worksheet
Record Your Fall Favorites
Second Grade
Data and Graphing
Use this template alongside the engaging lesson, “Let’s Graph Our Fall Favorites” to support kids in interpreting data.
Worksheet
Record Your Fall Favorites
Worksheet
Record Your Fall Favorites
Use this template alongside the engaging lesson, “Let’s Graph Our Fall Favorites” to support kids in interpreting data.
Second Grade
Data and Graphing
Worksheet
Make a Venn Diagram: Gift Boxes
Worksheet
Make a Venn Diagram: Gift Boxes
Second Grade
Data and Graphing
Kids practice making a Venn diagram about kinds of gift wrap by sorting the gifts in their correct spaces in this 2nd grade math worksheet.
Worksheet
Make a Venn Diagram: Gift Boxes
Worksheet
Make a Venn Diagram: Gift Boxes
Kids practice making a Venn diagram about kinds of gift wrap by sorting the gifts in their correct spaces in this 2nd grade math worksheet.
Second Grade
Data and Graphing
Worksheet
Painting Pie Chart
Worksheet
Painting Pie Chart
Second Grade
Data and Graphing
Help your child get her bearings around graphs and charts with this cute, kid-approved pie chart.
Worksheet
Painting Pie Chart
Worksheet
Painting Pie Chart
Help your child get her bearings around graphs and charts with this cute, kid-approved pie chart.
Second Grade
Data and Graphing
Worksheet
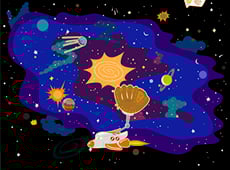
Scaled Bar Graphs in Space
Game
Scaled Bar Graphs in Space
Third Grade
Data and Graphing
Out of this world! Kids help Roly collect, sort, and graph random objects in this silly space game.
Game
Scaled Bar Graphs in Space
Game
Scaled Bar Graphs in Space
Out of this world! Kids help Roly collect, sort, and graph random objects in this silly space game.
Third Grade
Data and Graphing
Game
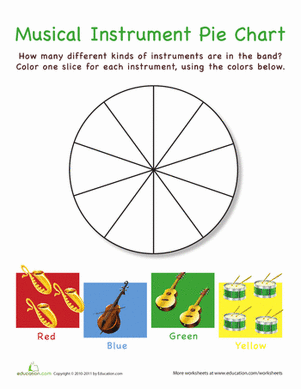
Musical Instrument Pie Chart
Worksheet
Musical Instrument Pie Chart
Second Grade
Data and Graphing
Help your child get her bearings around charts and graphs with these cute pie chart worksheets with plenty of kid appeal.
Worksheet
Musical Instrument Pie Chart
Worksheet
Musical Instrument Pie Chart
Help your child get her bearings around charts and graphs with these cute pie chart worksheets with plenty of kid appeal.
Second Grade
Data and Graphing
Worksheet
Musical Instruments Pie Chart
Worksheet
Musical Instruments Pie Chart
Second Grade
Data and Graphing
Pie makes pretty much anything better, especially math. Help your kid learn about graphs with this nonthreatening pie chart featuring musical instruments.
Worksheet
Musical Instruments Pie Chart
Worksheet
Musical Instruments Pie Chart
Pie makes pretty much anything better, especially math. Help your kid learn about graphs with this nonthreatening pie chart featuring musical instruments.
Second Grade
Data and Graphing
Worksheet
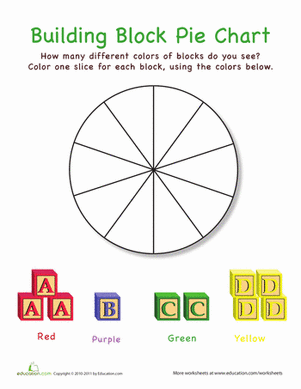
Building Block Pie Chart
Worksheet
Building Block Pie Chart
Second Grade
Data and Graphing
Help your child get his bearings around charts and graphs with these cute pie charts that have plenty of kid appeal.
Worksheet
Building Block Pie Chart
Worksheet
Building Block Pie Chart
Help your child get his bearings around charts and graphs with these cute pie charts that have plenty of kid appeal.
Second Grade
Data and Graphing
Worksheet
Olympic Probability: Archery #2
Worksheet
Olympic Probability: Archery #2
Fifth Grade
Data and Graphing
Hit your target with probability! Your student can practice probability the Olympic way, with this archery-themed math sheet.
Worksheet
Olympic Probability: Archery #2
Worksheet
Olympic Probability: Archery #2
Hit your target with probability! Your student can practice probability the Olympic way, with this archery-themed math sheet.
Fifth Grade
Data and Graphing
Worksheet
Bar Graphing with Roly
Game
Bar Graphing with Roly
Second Grade
Data and Graphing
Stop those germs! Kids must catch germs as they drop and prevent people from getting sick in this icky data and graphing game.
Game
Bar Graphing with Roly
Game
Bar Graphing with Roly
Stop those germs! Kids must catch germs as they drop and prevent people from getting sick in this icky data and graphing game.
Second Grade
Data and Graphing
Game
Measurement and Data 4
Guided Lesson
Measurement and Data 4
Fourth Grade
Fractions
Representing data on graphs makes math visual and involves some creativity and design. Plotting data using fractional units takes their learning one step further. Also in this unit, students learn to measure using both traditional units (like inches, feet and yards) and metric units, and how to convert measurements within each system. The concept of measurement gets two dimensional when students explore measuring and working with angles.
Guided Lesson
Measurement and Data 4
Guided Lesson
Measurement and Data 4
Representing data on graphs makes math visual and involves some creativity and design. Plotting data using fractional units takes their learning one step further. Also in this unit, students learn to measure using both traditional units (like inches, feet and yards) and metric units, and how to convert measurements within each system. The concept of measurement gets two dimensional when students explore measuring and working with angles.
Fourth Grade
Fractions
Guided Lesson
Data 1
Guided Lesson
Data 1
Third Grade
Fractions
Learning how to represent numerical information is a key part of the third grade math curriculum. This lesson in data provides guided instruction designed by our team of curriculum experts and teachers to present this concept in an engaging way. Not only that, but helpful exercises help kids to see the practical applicaton of these skills in the real world.
Guided Lesson
Data 1
Guided Lesson
Data 1
Learning how to represent numerical information is a key part of the third grade math curriculum. This lesson in data provides guided instruction designed by our team of curriculum experts and teachers to present this concept in an engaging way. Not only that, but helpful exercises help kids to see the practical applicaton of these skills in the real world.
Third Grade
Fractions
Guided Lesson
Probability and Statistics 2
Exercise
Probability and Statistics 2
Fourth Grade
Data and Graphing
Continue the probability and statistics fun with this involving exercise that shows students how to use data to make predictions.
Exercise
Probability and Statistics 2
Exercise
Probability and Statistics 2
Continue the probability and statistics fun with this involving exercise that shows students how to use data to make predictions.
Fourth Grade
Data and Graphing
Exercise
Data 2
Guided Lesson
Data 2
Fifth Grade
Fractions
Understanding data and graphs is a critical skill that we use on a regular basis to read news articles, reports and other media to interpret information. In this unit, students investigate data collection, data organization and visual representation in different kinds of graphics (i.e. line plots, pie charts). Learners also apply concepts of probability and statistics to analyze data.
Guided Lesson
Data 2
Guided Lesson
Data 2
Understanding data and graphs is a critical skill that we use on a regular basis to read news articles, reports and other media to interpret information. In this unit, students investigate data collection, data organization and visual representation in different kinds of graphics (i.e. line plots, pie charts). Learners also apply concepts of probability and statistics to analyze data.
Fifth Grade
Fractions
Guided Lesson
Geometry 7
Guided Lesson
Geometry 7
Fifth Grade
Geometry
This geometry unit engages students in analytical thinking as they learn about the properties of two dimensional figures and consider the different ways they can be sorted based on those properties. Students also learn to plot points, lines and shapes on a coordinate graph.
Guided Lesson
Geometry 7
Guided Lesson
Geometry 7
This geometry unit engages students in analytical thinking as they learn about the properties of two dimensional figures and consider the different ways they can be sorted based on those properties. Students also learn to plot points, lines and shapes on a coordinate graph.
Fifth Grade
Geometry
Guided Lesson
Picture Graphing with Fish
Game
Picture Graphing with Fish
Third Grade
Data and Graphing
Fish, fish everywhere! Kids catch fish to sort and graph in this zany game.
Game
Picture Graphing with Fish
Game
Picture Graphing with Fish
Fish, fish everywhere! Kids catch fish to sort and graph in this zany game.
Third Grade
Data and Graphing
Game
Probability and Statistics 1
Exercise
Probability and Statistics 1
Third Grade
Data and Graphing
This engaging exercise will introduce students to probability and statistics in a way that excites them to continue learning.
Exercise
Probability and Statistics 1
Exercise
Probability and Statistics 1
This engaging exercise will introduce students to probability and statistics in a way that excites them to continue learning.
Third Grade
Data and Graphing
Exercise
Zap and Kreb: Graphing Word Problems
Game
Zap and Kreb: Graphing Word Problems
Third Grade
Data and Graphing
Kids journey to Earth with aliens Zap and Kreb on a mission to gather data and create graphs in a math story that's out of this world!
Game
Zap and Kreb: Graphing Word Problems
Game
Zap and Kreb: Graphing Word Problems
Kids journey to Earth with aliens Zap and Kreb on a mission to gather data and create graphs in a math story that's out of this world!
Third Grade
Data and Graphing
Game
Math + Love = Valentine's Day Bar Graph
Lesson Plan
Math + Love = Valentine's Day Bar Graph
Second Grade
Data and Graphing
What's more romantic than a bar graph on Valentine's Day? In this Valentine's Day lesson plan, students will use information from a data set to create their own tally charts and bar graphs and then analyze these graphs to answer questions.
Lesson Plan
Math + Love = Valentine's Day Bar Graph
Lesson Plan
Math + Love = Valentine's Day Bar Graph
What's more romantic than a bar graph on Valentine's Day? In this Valentine's Day lesson plan, students will use information from a data set to create their own tally charts and bar graphs and then analyze these graphs to answer questions.
Second Grade
Data and Graphing
Lesson Plan
Let's Graph Our Fall Favorites!
Lesson Plan
Let's Graph Our Fall Favorites!
Second Grade
Data and Graphing
This engaging math lesson combines all of your kid's fall favorites as they learn to represent data using a bar graph.
Lesson Plan
Let's Graph Our Fall Favorites!
Lesson Plan
Let's Graph Our Fall Favorites!
This engaging math lesson combines all of your kid's fall favorites as they learn to represent data using a bar graph.
Second Grade
Data and Graphing
Lesson Plan
1
…
8
9
10
11