Histograms Resources
5 results
Math
✕Sort by:
5 results
Sort by:
About Histograms Resources
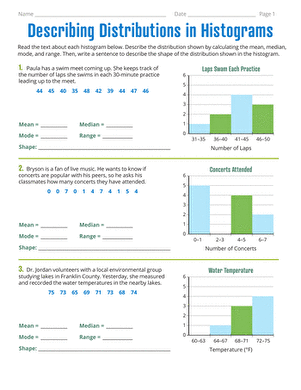
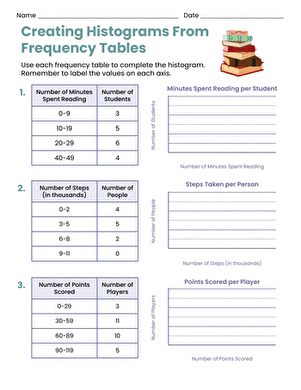
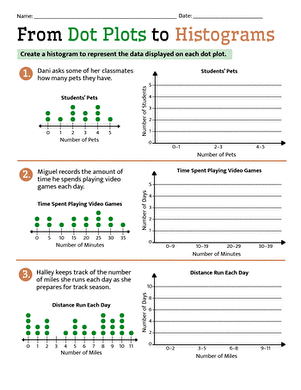
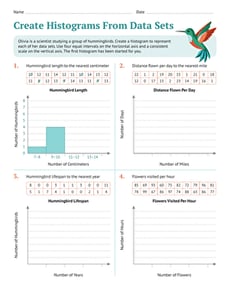
On Education.com, Histograms Resources provide students and educators with visual tools for exploring data distribution. This includes printable worksheets, lesson plans, and interactive materials that teach how to interpret frequency, skewness, and spread in sets of data. These resources help learners grasp concepts like bins, ranges, and frequency tables, making data analysis accessible and engaging.
Examples of materials include practicing histograms through graphing exercises, analyzing real-world data sets, and using tables to count and compare frequencies. Educators can incorporate these resources into lessons on statistics, data literacy, or classroom projects. Parents can use hands-on activities at home to strengthen children’s understanding of collections, measurement, and interpretation skills.
This set of Resources makes teaching and learning about histograms easier and more interactive while reinforcing curriculum standards. Users can access ready-made worksheets, visual examples, and guided exercises that foster active engagement with data. These materials support building foundational skills in Welcome to Data and Patterns for students across multiple grade levels, including 3rd grade, 4th grade, and beyond. They also provide practical, educational activities for classroom settings and at-homelearning.


