Common Core Histograms Resources
Common Core Quick Links:
Common Core State Standards6 results
Math
✕Common Core
✕6 results
Common Core Histograms Resources
Common Core Quick Links:
Common Core State Standards6 results
Math
✕Common Core
✕6 results


About Common Core Histograms Resources
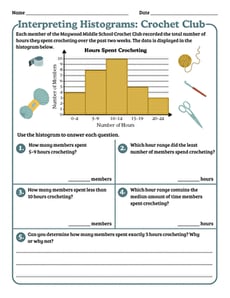
On Education.com, Common Core Histograms Resources provide worksheets, printable activities, and lesson plans that help students learn to create and interpret histograms, a key data visualization tool. These resources make understanding data sets, identifying patterns, and representing frequency distributions engaging and accessible for 4th through 7th-grade students. Exploring these materials supports mathematical reasoning and fosters critical thinking skills essential for data literacy.
The site offers a variety of digital simulations, practice worksheets, and hands-on activities that expand on histogram concepts. Educators and parents can access resources to provide guided lessons or independent practice, ensuring students build strong foundational skills in data analysis. Using these tools throughout lessons encourages learners to apply graphing techniques across disciplines, from mathematics to science.
By using Common Core Histograms Resources, teachers can easily integrate visual data representation into their classroom curriculum, while parents can reinforce learning at home. These materials save preparation time and provide structured guidance for instructing students on the importance of data analysis, graph creation, and pattern recognition. Creative hands-on projects using graphing and pie charts promote engagement and relate to everyday experiences, making learning lively and meaningful.