SKIP TO CONTENT
Worksheet Generator
Subjects
Grades
Worksheets
Games
Build a Worksheet
More Resources
Roly Recommends
Subjects
Grades
Worksheets
Games
Build a Worksheet
More Resources
Roly Recommends
Filters
Search for: axis
✕
Lesson Plans
✕
Common Core
✕
Subjects
Math
English Language Arts
Science
Grade Level
Pre-K
K
1st
2nd
3rd
4th
5th
6th
7th
8th
Early Childhood
Elementary School
Middle School
Resource Type
Worksheets
Games
Lesson Plans
Activities
Common Core
Yes
English Language Support
Yes
See More
Clear All
View 18 results
Showing Results for axis
18 results
Search for: axis
✕
Lesson Plans
✕
Common Core
✕
Clear All
Sort by:
Relevance
Most recent
Most popular
Alphabetical A-Z
Alphabetical Z-A
All filters
18 results
Sort by:
Relevance
Most recent
Most popular
Alphabetical A-Z
Alphabetical Z-A
Creating Graphs: Classroom Scavengers
Lesson Plan
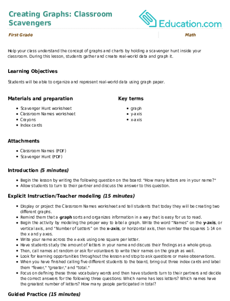
Creating Graphs: Classroom Scavengers
First Grade
Help your class understand the concept of graphs and charts by holding a scavenger hunt inside your classroom. During this lesson, students gather and create real-world data and graph it.
Lesson Plan
Creating Graphs: Classroom Scavengers
Lesson Plan
Creating Graphs: Classroom Scavengers
Help your class understand the concept of graphs and charts by holding a scavenger hunt inside your classroom. During this lesson, students gather and create real-world data and graph it.
First Grade
Lesson Plan
Making Bar Graphs: Graph It!
Lesson Plan
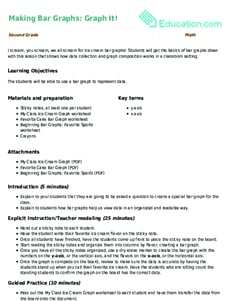
Making Bar Graphs: Graph It!
Second Grade
I scream, you scream, we all scream for ice cream bar graphs! Students will get the basics of bar graphs down with this lesson that shows how data collection and graph composition works in a classroom setting.
Lesson Plan
Making Bar Graphs: Graph It!
Lesson Plan
Making Bar Graphs: Graph It!
I scream, you scream, we all scream for ice cream bar graphs! Students will get the basics of bar graphs down with this lesson that shows how data collection and graph composition works in a classroom setting.
Second Grade
Lesson Plan
EL
What Does the Graph Show?
Lesson Plan
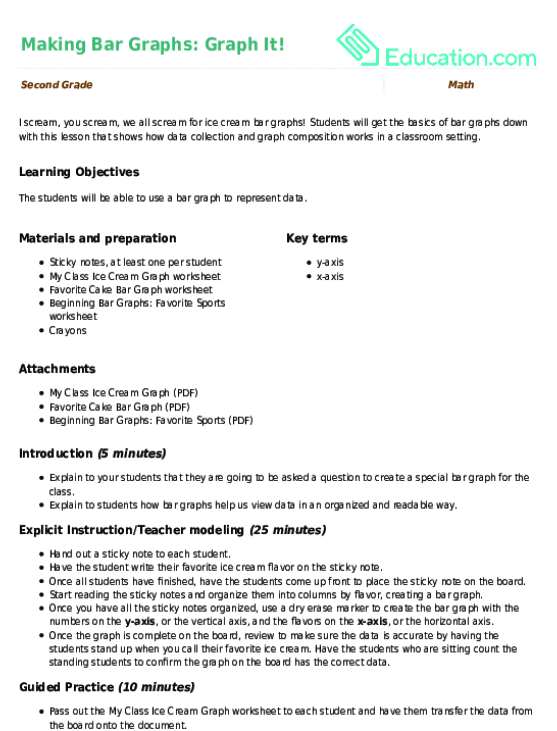
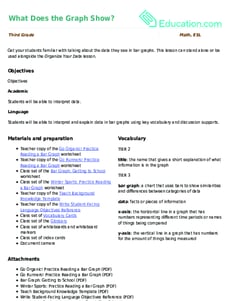
What Does the Graph Show?
Third Grade
Get your students familiar with talking about the data they see in bar graphs. This lesson can stand alone or be used alongside the
Organize Your Data
lesson.
Lesson Plan
EL
What Does the Graph Show?
Lesson Plan
What Does the Graph Show?
Get your students familiar with talking about the data they see in bar graphs. This lesson can stand alone or be used alongside the
Organize Your Data
lesson.
Third Grade
Lesson Plan
Math + Love = Valentine's Day Bar Graph
Lesson Plan
Math + Love = Valentine's Day Bar Graph
Second Grade
Data and Graphing
What's more romantic than a bar graph on Valentine's Day? In this Valentine's Day lesson plan, students will use information from a data set to create their own tally charts and bar graphs and then analyze these graphs to answer questions.
Lesson Plan
Math + Love = Valentine's Day Bar Graph
Lesson Plan
Math + Love = Valentine's Day Bar Graph
What's more romantic than a bar graph on Valentine's Day? In this Valentine's Day lesson plan, students will use information from a data set to create their own tally charts and bar graphs and then analyze these graphs to answer questions.
Second Grade
Data and Graphing
Lesson Plan
Collect, Organize, Display, Analyze
Lesson Plan
Collect, Organize, Display, Analyze
Second Grade
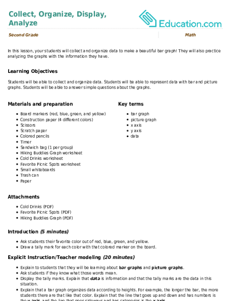
In this lesson, your students will collect and organize data to make a beautiful bar graph! They will also practice analyzing the graphs with the information they have.
Lesson Plan
Collect, Organize, Display, Analyze
Lesson Plan
Collect, Organize, Display, Analyze
In this lesson, your students will collect and organize data to make a beautiful bar graph! They will also practice analyzing the graphs with the information they have.
Second Grade
Lesson Plan
Organize Your Data
Lesson Plan
Organize Your Data
Third Grade
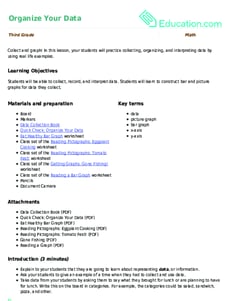
Collect and graph! In this lesson, your students will practice collecting, organizing, and interpreting data by using real life examples.
Lesson Plan
Organize Your Data
Lesson Plan
Organize Your Data
Collect and graph! In this lesson, your students will practice collecting, organizing, and interpreting data by using real life examples.
Third Grade
Lesson Plan
Line Plots: Representing the Length of Classroom Items
Lesson Plan
Line Plots: Representing the Length of Classroom Items
Second Grade
Measurement
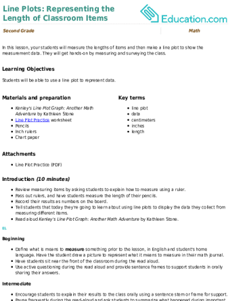
In this lesson, your students will measure the lengths of items and then make a line plot to show the measurement data. They will get hands-on by measuring and surveying the class.
Lesson Plan
Line Plots: Representing the Length of Classroom Items
Lesson Plan
Line Plots: Representing the Length of Classroom Items
In this lesson, your students will measure the lengths of items and then make a line plot to show the measurement data. They will get hands-on by measuring and surveying the class.
Second Grade
Measurement
Lesson Plan
Let's Graph Our Fall Favorites!
Lesson Plan
Let's Graph Our Fall Favorites!
Second Grade
Data and Graphing
This engaging math lesson combines all of your kid's fall favorites as they learn to represent data using a bar graph.
Lesson Plan
Let's Graph Our Fall Favorites!
Lesson Plan
Let's Graph Our Fall Favorites!
This engaging math lesson combines all of your kid's fall favorites as they learn to represent data using a bar graph.
Second Grade
Data and Graphing
Lesson Plan
Interpreting Data by Creating Graphs
Lesson Plan
Interpreting Data by Creating Graphs
Fifth Grade
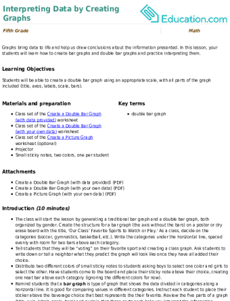
Graphs bring data to life and help us draw conclusions about the information presented. In this lesson, your students will learn how to create bar graphs and double bar graphs and practice interpreting them.
Lesson Plan
Interpreting Data by Creating Graphs
Lesson Plan
Interpreting Data by Creating Graphs
Graphs bring data to life and help us draw conclusions about the information presented. In this lesson, your students will learn how to create bar graphs and double bar graphs and practice interpreting them.
Fifth Grade
Lesson Plan
Next Level Functions
Lesson Plan
Next Level Functions
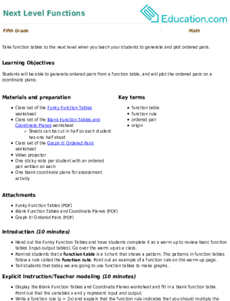
Fifth Grade
Take function tables to the next level when you teach your students to generate and plot ordered pairs.
Lesson Plan
Next Level Functions
Lesson Plan
Next Level Functions
Take function tables to the next level when you teach your students to generate and plot ordered pairs.
Fifth Grade
Lesson Plan
Shoe, Graph, Shoe!
Lesson Plan
Shoe, Graph, Shoe!
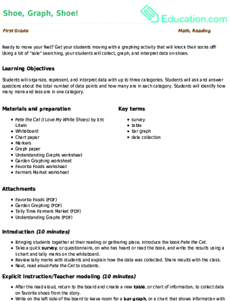
First Grade
Ready to move your feet? Get your students moving with a graphing activity that will knock their socks off! Using a bit of “sole” searching, your students will collect, graph, and interpret data on shoes.
Lesson Plan
Shoe, Graph, Shoe!
Lesson Plan
Shoe, Graph, Shoe!
Ready to move your feet? Get your students moving with a graphing activity that will knock their socks off! Using a bit of “sole” searching, your students will collect, graph, and interpret data on shoes.
First Grade
Lesson Plan
Star Unit
Lesson Plan
Star Unit
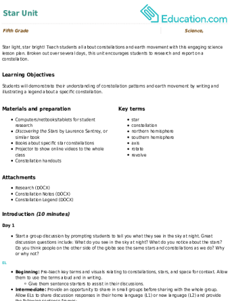
Fifth Grade
Earth and Space Science
Star light, star bright! Teach students all about constellations and earth movement with this engaging science lesson plan. Broken out over several days, this unit encourages students to research and report on a constellation.
Lesson Plan
Star Unit
Lesson Plan
Star Unit
Star light, star bright! Teach students all about constellations and earth movement with this engaging science lesson plan. Broken out over several days, this unit encourages students to research and report on a constellation.
Fifth Grade
Earth and Space Science
Lesson Plan
Explore the Seasons
Lesson Plan
Explore the Seasons
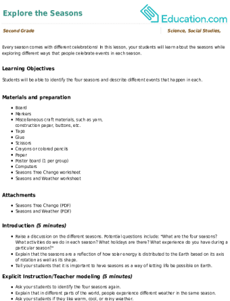
Second Grade
Earth and Space Science
Every season comes with different celebrations! In this lesson, your students will learn about the seasons while exploring different ways that people celebrate events in each season.
Lesson Plan
Explore the Seasons
Lesson Plan
Explore the Seasons
Every season comes with different celebrations! In this lesson, your students will learn about the seasons while exploring different ways that people celebrate events in each season.
Second Grade
Earth and Space Science
Lesson Plan
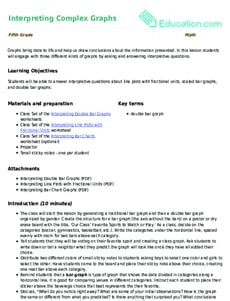
Interpreting Complex Graphs
Lesson Plan
Interpreting Complex Graphs
Fifth Grade
Math
Graphs bring data to life and help us draw conclusions about the information presented. In this lesson students will engage with three different kinds of graphs by asking and answering interpretive questions.
Lesson Plan
Interpreting Complex Graphs
Lesson Plan
Interpreting Complex Graphs
Graphs bring data to life and help us draw conclusions about the information presented. In this lesson students will engage with three different kinds of graphs by asking and answering interpretive questions.
Fifth Grade
Math
Lesson Plan
EL
Understanding Line Plots
Lesson Plan
Understanding Line Plots
Second Grade
Writing
This lesson provides students with the opportunity to critically think about data. Use this lesson alongside Line Plots: Representing the Length of Classroom Items or as a stand alone lesson.
Lesson Plan
EL
Understanding Line Plots
Lesson Plan
Understanding Line Plots
This lesson provides students with the opportunity to critically think about data. Use this lesson alongside Line Plots: Representing the Length of Classroom Items or as a stand alone lesson.
Second Grade
Writing
Lesson Plan
Asking and Answering Questions about Line Plots and Bar Graphs
Lesson Plan
Asking and Answering Questions about Line Plots and Bar Graphs
Third Grade
Take students’ understanding of bar graphs and line plots to the next level. This lesson will encourage students to think about how graphs are designed and the questions we can ask and answer about data presented in graphs.
Lesson Plan
Asking and Answering Questions about Line Plots and Bar Graphs
Lesson Plan
Asking and Answering Questions about Line Plots and Bar Graphs
Take students’ understanding of bar graphs and line plots to the next level. This lesson will encourage students to think about how graphs are designed and the questions we can ask and answer about data presented in graphs.
Third Grade
Lesson Plan
EL
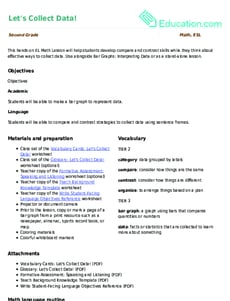
Let's Collect Data!
Lesson Plan
Let's Collect Data!
Second Grade
This hands-on EL Math Lesson will help students develop compare and contrast skills while they think about effective ways to collect data. Use alongside Bar Graphs: Interpreting Data or as a stand-alone lesson.
Lesson Plan
EL
Let's Collect Data!
Lesson Plan
Let's Collect Data!
This hands-on EL Math Lesson will help students develop compare and contrast skills while they think about effective ways to collect data. Use alongside Bar Graphs: Interpreting Data or as a stand-alone lesson.
Second Grade
Lesson Plan
Bar Graphs: Interpreting Data
Lesson Plan
Bar Graphs: Interpreting Data
Second Grade
Data and Graphing
In this lesson, students will make bar graphs and interpret data using real-life data from other students. They will get practice writing and answering survey questions.
Lesson Plan
Bar Graphs: Interpreting Data
Lesson Plan
Bar Graphs: Interpreting Data
In this lesson, students will make bar graphs and interpret data using real-life data from other students. They will get practice writing and answering survey questions.
Second Grade
Data and Graphing
Lesson Plan
1