SKIP TO CONTENT
Worksheet Generator
Subjects
Grades
Worksheets
Games
Build a Worksheet
More Resources
Roly Recommends
Subjects
Grades
Worksheets
Games
Build a Worksheet
More Resources
Roly Recommends
All Subjects
Math
Data and Graphing
Subtopics:
Collecting and Organizing Data
Picture Graphs
Bar Graphs
Line Plots
Coordinate Plane
Box Plots
Histograms
Scatter Plots
Show Less
Filters
Search for: -and--models
✕
Math
✕
Subjects
Math
English Language Arts
Science
Social Studies
Foreign Language
Grade Level
Pre-K
K
1st
2nd
3rd
4th
5th
6th
7th
8th
Early Childhood
Elementary School
Middle School
Resource Type
Worksheets
Games
Lesson Plans
Interactive Worksheets
Workbooks
Activities
Exercises
Stories
Songs
Offline Games
Guided Lessons
Teacher Resources
Occasion
Birthdays
St. Patrick's Day
Easter
Earth Day
Summer
Independence Day
Back to School
Fall
Halloween
Winter
Holidays
Thanksgiving
Christmas
Hanukkah
Lunar New Year
Valentine's Day
Common Core
Yes
Game Type
Mazes
Ball Games
Printable Board Games
Travel Games
Arts & Crafts
Arts & Crafts
Paper & Glue Crafts
Construction & Sculpture
Painting & Drawing
Recycled Crafts
Coloring
Yes
English Language Support
Yes
See More
Clear All
View 660 results
Showing Results for -and--models : Page 5
660 results
Search for: -and--models
✕
Math
✕
Sort by:
Relevance
Most recent
Most popular
Alphabetical A-Z
Alphabetical Z-A
All filters
660 results
Sort by:
Relevance
Most recent
Most popular
Alphabetical A-Z
Alphabetical Z-A
Mean, Median and Mode Madness!
Lesson Plan
Mean, Median and Mode Madness!
Third Grade
Data and Graphing
This lesson introduces students to the concepts of mean, median, and mode in a hands-on and visual way.
Lesson Plan
Mean, Median and Mode Madness!
Lesson Plan
Mean, Median and Mode Madness!
This lesson introduces students to the concepts of mean, median, and mode in a hands-on and visual way.
Third Grade
Data and Graphing
Lesson Plan
EL
Nature Counting
Lesson Plan
Nature Counting
Kindergarten
Data and Graphing
Use this fun lesson plan to introduce or review the concept of addition to your ELs. Can be used as a stand alone or support lesson for the
Nature and Counting It All Adds Up
lesson plan.
Lesson Plan
EL
Nature Counting
Lesson Plan
Nature Counting
Use this fun lesson plan to introduce or review the concept of addition to your ELs. Can be used as a stand alone or support lesson for the
Nature and Counting It All Adds Up
lesson plan.
Kindergarten
Data and Graphing
Lesson Plan
Graphing Colored Counters
Lesson Plan
Graphing Colored Counters
Kindergarten
Data and Graphing
In this lesson, your students will use the background knowledge that they have about counting and sorting to graph data. They will practice answering questions about the graph!
Lesson Plan
Graphing Colored Counters
Lesson Plan
Graphing Colored Counters
In this lesson, your students will use the background knowledge that they have about counting and sorting to graph data. They will practice answering questions about the graph!
Kindergarten
Data and Graphing
Lesson Plan
Let's Graph Our Fall Favorites!
Lesson Plan
Let's Graph Our Fall Favorites!
Second Grade
Data and Graphing
This engaging math lesson combines all of your kid's fall favorites as they learn to represent data using a bar graph.
Lesson Plan
Let's Graph Our Fall Favorites!
Lesson Plan
Let's Graph Our Fall Favorites!
This engaging math lesson combines all of your kid's fall favorites as they learn to represent data using a bar graph.
Second Grade
Data and Graphing
Lesson Plan
Mighty Mean, Median, and Mode
Lesson Plan
Mighty Mean, Median, and Mode
Fourth Grade
Data and Graphing
Give your students a good basis in interpreting data with this lesson that teaches them about mean, median, and mode with plenty of practice and cute videos to keep them interested.
Lesson Plan
Mighty Mean, Median, and Mode
Lesson Plan
Mighty Mean, Median, and Mode
Give your students a good basis in interpreting data with this lesson that teaches them about mean, median, and mode with plenty of practice and cute videos to keep them interested.
Fourth Grade
Data and Graphing
Lesson Plan
What is it Telling Me? Creating and Interpreting Line Plots
Lesson Plan
What is it Telling Me? Creating and Interpreting Line Plots
Third Grade
Data and Graphing
Line plots are a great way to introduce your students to graphing data. In this lesson, your students will learn how to create a line plot and also practice interpreting line plots.
Lesson Plan
What is it Telling Me? Creating and Interpreting Line Plots
Lesson Plan
What is it Telling Me? Creating and Interpreting Line Plots
Line plots are a great way to introduce your students to graphing data. In this lesson, your students will learn how to create a line plot and also practice interpreting line plots.
Third Grade
Data and Graphing
Lesson Plan
Olympic Math: Mean, Median and Mode Review
Lesson Plan
Olympic Math: Mean, Median and Mode Review
Fifth Grade
Data and Graphing
Help your students win gold with this lesson that gives them plenty of practice with mode, median, and mean.
Lesson Plan
Olympic Math: Mean, Median and Mode Review
Lesson Plan
Olympic Math: Mean, Median and Mode Review
Help your students win gold with this lesson that gives them plenty of practice with mode, median, and mean.
Fifth Grade
Data and Graphing
Lesson Plan
Bar Graphs: Interpreting Data
Lesson Plan
Bar Graphs: Interpreting Data
Second Grade
Data and Graphing
In this lesson, students will make bar graphs and interpret data using real-life data from other students. They will get practice writing and answering survey questions.
Lesson Plan
Bar Graphs: Interpreting Data
Lesson Plan
Bar Graphs: Interpreting Data
In this lesson, students will make bar graphs and interpret data using real-life data from other students. They will get practice writing and answering survey questions.
Second Grade
Data and Graphing
Lesson Plan
Interpreting Data Using Graphs
Lesson Plan
Interpreting Data Using Graphs
Kindergarten
Data and Graphing
Engage students in learning about data by analyzing picture graphs, then collecting data from classmates and making their own graphs!
Lesson Plan
Interpreting Data Using Graphs
Lesson Plan
Interpreting Data Using Graphs
Engage students in learning about data by analyzing picture graphs, then collecting data from classmates and making their own graphs!
Kindergarten
Data and Graphing
Lesson Plan
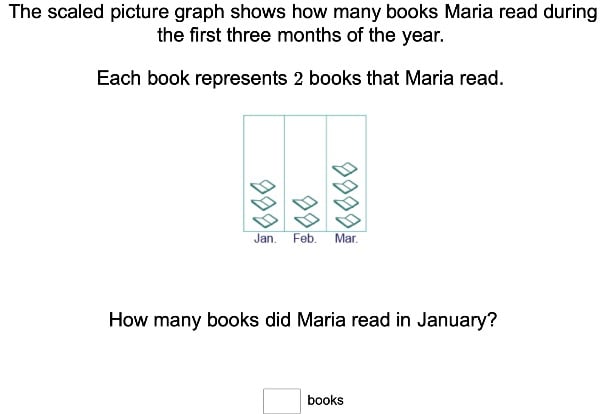
Scaled Picture Graphs
Exercise
Scaled Picture Graphs
Third Grade
Data and Graphing
For amateur mathematicians, this exercise will incorporate neat pictures into math time with scaled picture graphs.
Exercise
Scaled Picture Graphs
Exercise
Scaled Picture Graphs
For amateur mathematicians, this exercise will incorporate neat pictures into math time with scaled picture graphs.
Third Grade
Data and Graphing
Exercise
Collecting and Organizing Data 3
Exercise
Collecting and Organizing Data 3
Fifth Grade
Data and Graphing
By the time students complete this third exercise in the series, they will have become masters of collecting and organizing data.
Exercise
Collecting and Organizing Data 3
Exercise
Collecting and Organizing Data 3
By the time students complete this third exercise in the series, they will have become masters of collecting and organizing data.
Fifth Grade
Data and Graphing
Exercise
Collecting and Organizing Data 2
Exercise
Collecting and Organizing Data 2
Fourth Grade
Data and Graphing
Your students will grow adept at collecting and organizing data around them with this engaging exercise.
Exercise
Collecting and Organizing Data 2
Exercise
Collecting and Organizing Data 2
Your students will grow adept at collecting and organizing data around them with this engaging exercise.
Fourth Grade
Data and Graphing
Exercise
Collecting and Organizing Data 1
Exercise
Collecting and Organizing Data 1
Third Grade
Data and Graphing
Students will learn how to collect and organize data thanks to this interesting exercise from Education.com.
Exercise
Collecting and Organizing Data 1
Exercise
Collecting and Organizing Data 1
Students will learn how to collect and organize data thanks to this interesting exercise from Education.com.
Third Grade
Data and Graphing
Exercise
Measurement and Graphing 1
Exercise
Measurement and Graphing 1
Third Grade
Fractions
This exercise will introduce students to the concept of taking measurements and graphing the data.
Exercise
Measurement and Graphing 1
Exercise
Measurement and Graphing 1
This exercise will introduce students to the concept of taking measurements and graphing the data.
Third Grade
Fractions
Exercise
Probability and Statistics 3
Exercise
Probability and Statistics 3
Fifth Grade
Data and Graphing
After completing this third probability and statistics exercise, your students will seek out working on game theory on their own.
Exercise
Probability and Statistics 3
Exercise
Probability and Statistics 3
After completing this third probability and statistics exercise, your students will seek out working on game theory on their own.
Fifth Grade
Data and Graphing
Exercise
Probability and Statistics 2
Exercise
Probability and Statistics 2
Fourth Grade
Data and Graphing
Continue the probability and statistics fun with this involving exercise that shows students how to use data to make predictions.
Exercise
Probability and Statistics 2
Exercise
Probability and Statistics 2
Continue the probability and statistics fun with this involving exercise that shows students how to use data to make predictions.
Fourth Grade
Data and Graphing
Exercise
Probability and Statistics 1
Exercise
Probability and Statistics 1
Third Grade
Data and Graphing
This engaging exercise will introduce students to probability and statistics in a way that excites them to continue learning.
Exercise
Probability and Statistics 1
Exercise
Probability and Statistics 1
This engaging exercise will introduce students to probability and statistics in a way that excites them to continue learning.
Third Grade
Data and Graphing
Exercise
Line Plots and Unit Fractions
Exercise
Line Plots and Unit Fractions
Fourth Grade
Fractions
Understanding unit fractions is a lot easier with this exercise that lays out all out on line plots.
Exercise
Line Plots and Unit Fractions
Exercise
Line Plots and Unit Fractions
Understanding unit fractions is a lot easier with this exercise that lays out all out on line plots.
Fourth Grade
Fractions
Exercise
Scaled Bar Graphs
Exercise
Scaled Bar Graphs
Third Grade
Data and Graphing
This exercise will clarify just how scaled bar graphs represent data found in math problems.
Exercise
Scaled Bar Graphs
Exercise
Scaled Bar Graphs
This exercise will clarify just how scaled bar graphs represent data found in math problems.
Third Grade
Data and Graphing
Exercise
Same And Different Song
Song
Same And Different Song
Pre-K
Data and Graphing
Sing a sorting song and learn about same and different. In this song, kids pick the item that doesn't belong and figure out exactly what makes it different.
Song
Same And Different Song
Song
Same And Different Song
Sing a sorting song and learn about same and different. In this song, kids pick the item that doesn't belong and figure out exactly what makes it different.
Pre-K
Data and Graphing
Song
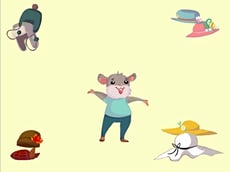
Sorting Hats Song
Song
Sorting Hats Song
Kindergarten
Data and Graphing
Learning how to group and sort? Organize these hats and learn how to sort along the way.
Song
Sorting Hats Song
Song
Sorting Hats Song
Learning how to group and sort? Organize these hats and learn how to sort along the way.
Kindergarten
Data and Graphing
Song
The Platypus
Story
The Platypus
Pre-K
Data and Graphing
Kids learn how to classify and categorize with this charming interactive story.
Story
The Platypus
Story
The Platypus
Kids learn how to classify and categorize with this charming interactive story.
Pre-K
Data and Graphing
Story
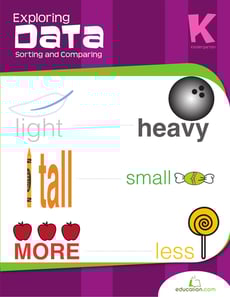
Exploring Data: Sorting and Comparing
Workbook
Exploring Data: Sorting and Comparing
Kindergarten
Numbers and Counting
There is a mix of objects in this workbook and it's up to your child to sort them by colors, shapes and sizes. Plus, he'll practice identifying weight and making simple comparisons.
Workbook
Exploring Data: Sorting and Comparing
Workbook
Exploring Data: Sorting and Comparing
There is a mix of objects in this workbook and it's up to your child to sort them by colors, shapes and sizes. Plus, he'll practice identifying weight and making simple comparisons.
Kindergarten
Numbers and Counting
Workbook
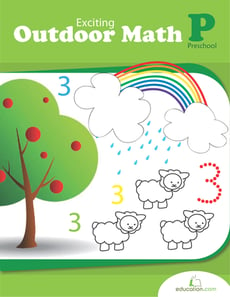
Exciting Outdoor Math
Workbook
Exciting Outdoor Math
Pre-K
Addition
Children learn early math by dealing with objects in place of numbers. These worksheets cover concepts of quantity, counting, and even adding and subtracting, using animals and nature to help teach.
Workbook
Exciting Outdoor Math
Workbook
Exciting Outdoor Math
Children learn early math by dealing with objects in place of numbers. These worksheets cover concepts of quantity, counting, and even adding and subtracting, using animals and nature to help teach.
Pre-K
Addition
Workbook
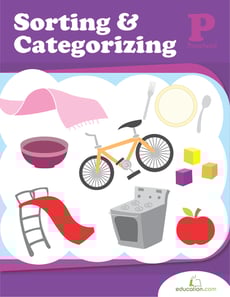
Sorting and Categorizing
Workbook
Sorting and Categorizing
Pre-K
Numbers and Counting
What better way to learn sorting and categorizing than with familiar objects preschoolers see every day? This workbook is great for practice sorting and comparing, using household items.
Workbook
Sorting and Categorizing
Workbook
Sorting and Categorizing
What better way to learn sorting and categorizing than with familiar objects preschoolers see every day? This workbook is great for practice sorting and comparing, using household items.
Pre-K
Numbers and Counting
Workbook
Shape, Texture, Size, and Color: Exploring Attributes
Workbook
Shape, Texture, Size, and Color: Exploring Attributes
Kindergarten
Geometry
Explore early geometry concepts, such as two-dimensional shapes, and sorting and categorizing attributes.
Workbook
Shape, Texture, Size, and Color: Exploring Attributes
Workbook
Shape, Texture, Size, and Color: Exploring Attributes
Explore early geometry concepts, such as two-dimensional shapes, and sorting and categorizing attributes.
Kindergarten
Geometry
Workbook
What Are the Odds?
Workbook
What Are the Odds?
Fifth Grade
Data and Graphing
A roll of the dice. A flip of a coin. A game of rock, paper, scissors. Kids are calculating probability all the time. The ability to predict outcomes based on the odds is the focus of this series.
Workbook
What Are the Odds?
Workbook
What Are the Odds?
A roll of the dice. A flip of a coin. A game of rock, paper, scissors. Kids are calculating probability all the time. The ability to predict outcomes based on the odds is the focus of this series.
Fifth Grade
Data and Graphing
Workbook
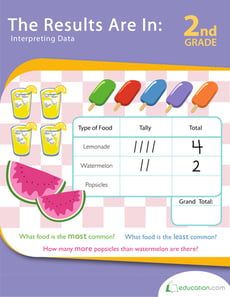
The Results Are In: Interpreting Data
Workbook
The Results Are In: Interpreting Data
Second Grade
Data and Graphing
Pictures and information go hand-in-hand in this workbook. Take a bite out of simple graphing and savor the math!
Workbook
The Results Are In: Interpreting Data
Workbook
The Results Are In: Interpreting Data
Pictures and information go hand-in-hand in this workbook. Take a bite out of simple graphing and savor the math!
Second Grade
Data and Graphing
Workbook
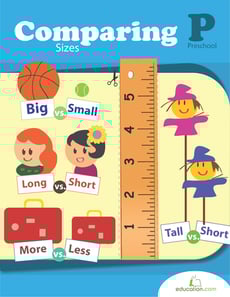
Comparing Sizes
Workbook
Comparing Sizes
Pre-K
Numbers and Counting
With these worksheets children use their logical thinking to distinguish the difference between objects such as tall or short, more or less. Measuring helps kids understand the dimensions of objects.
Workbook
Comparing Sizes
Workbook
Comparing Sizes
With these worksheets children use their logical thinking to distinguish the difference between objects such as tall or short, more or less. Measuring helps kids understand the dimensions of objects.
Pre-K
Numbers and Counting
Workbook
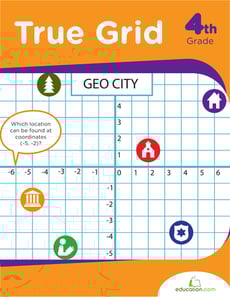
True Grid
Workbook
True Grid
Fourth Grade
Data and Graphing
Math can be a gritty business but, this workbook breaks down coordinate grids from different angles, from plotting simple points to finding hidden spies.
Workbook
True Grid
Workbook
True Grid
Math can be a gritty business but, this workbook breaks down coordinate grids from different angles, from plotting simple points to finding hidden spies.
Fourth Grade
Data and Graphing
Workbook
1
…
4
5
6
…
22