SKIP TO CONTENT
Worksheet Generator
Subjects
Grades
Worksheets
Games
Build a Worksheet
More Resources
Roly Recommends
Summer Boost
Subjects
Grades
Worksheets
Games
Build a Worksheet
More Resources
Roly Recommends
Summer Boost
Showing Results for times tables
Filters
Math
Data and Graphing
32 results
Search for: times, tables
✕
Math
✕
Clear all
32 results
Subtopics:
Collecting and Organizing Data
Picture Graphs
Bar Graphs
Line Plots
Coordinate Plane
Box Plots
Histograms
Show Less
Filters
Search for: times, tables
✕
Math
✕
Subjects
Math
English Language Arts
Science
Social Studies
Foreign Language
Technology
Grade Level
Pre-K
K
1st
2nd
3rd
4th
5th
6th
7th
8th
Early Childhood
Elementary School
Middle School
Resource Type
Worksheets
Lesson Plans
Interactive Worksheets
Activities
Offline Games
Teacher Resources
Occasion
St. Patrick's Day
Summer
Holidays
Common Core
Yes
Game Type
Ball Games
Clear all
View 32 results
Showing Results for times tables
Filters
32 results
Search for: times, tables
✕
Math
✕
Clear all
32 results
Interpreting Two-Way Frequency Tables
Worksheet
Interpreting Two-Way Frequency Tables
Eighth Grade
Data and Graphing
Students analyze two-way frequency tables in the context of relatable scenarios in this eighth-grade math worksheet!
Worksheet
Interpreting Two-Way Frequency Tables
Worksheet
Interpreting Two-Way Frequency Tables
Students analyze two-way frequency tables in the context of relatable scenarios in this eighth-grade math worksheet!
Eighth Grade
Data and Graphing
Worksheet
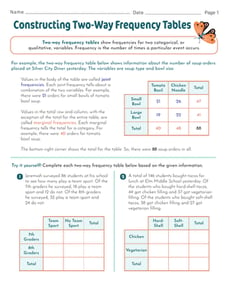
Constructing Two-Way Frequency Tables
Interactive Worksheet
Constructing Two-Way Frequency Tables
Eighth Grade
Data and Graphing
In this eighth-grade math worksheet, learners will then get to practice constructing two-way frequency tables given written descriptions of real-world data.
Interactive Worksheet
Constructing Two-Way Frequency Tables
Interactive Worksheet
Constructing Two-Way Frequency Tables
In this eighth-grade math worksheet, learners will then get to practice constructing two-way frequency tables given written descriptions of real-world data.
Eighth Grade
Data and Graphing
Interactive Worksheet
Constructing Two-Way Relative Frequency Tables
Interactive Worksheet
Constructing Two-Way Relative Frequency Tables
Eighth Grade
Data and Graphing
Practice creating two-way relative frequency tables based on real-world scenarios with this eighth-grade math worksheet!
Interactive Worksheet
Constructing Two-Way Relative Frequency Tables
Interactive Worksheet
Constructing Two-Way Relative Frequency Tables
Practice creating two-way relative frequency tables based on real-world scenarios with this eighth-grade math worksheet!
Eighth Grade
Data and Graphing
Interactive Worksheet
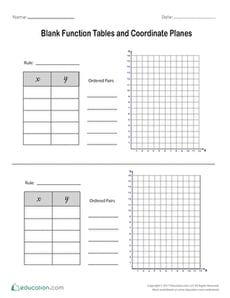
Blank Function Tables and Coordinate Planes
Worksheet
Blank Function Tables and Coordinate Planes
Fifth Grade
Geometry
Ask your students to use these blank function tables and coordinate planes to practice plotting ordered pairs.
Worksheet
Blank Function Tables and Coordinate Planes
Worksheet
Blank Function Tables and Coordinate Planes
Ask your students to use these blank function tables and coordinate planes to practice plotting ordered pairs.
Fifth Grade
Geometry
Worksheet
Creating Histograms From Frequency Tables
Worksheet
Creating Histograms From Frequency Tables
Sixth Grade
Data and Graphing
Practice using histograms to show different sets of data in this engaging sixth-grade worksheet!
Worksheet
Creating Histograms From Frequency Tables
Worksheet
Creating Histograms From Frequency Tables
Practice using histograms to show different sets of data in this engaging sixth-grade worksheet!
Sixth Grade
Data and Graphing
Worksheet
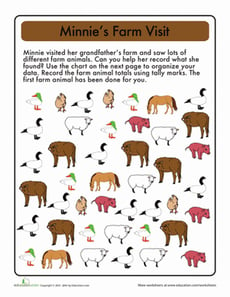
Tally Time: On the Farm
Worksheet
Tally Time: On the Farm
First Grade
Data and Graphing
Kids help Minnie figure out how many pigs, sheep, and other animals live on the farm by reading the tables and counting up the tally marks.
Worksheet
Tally Time: On the Farm
Worksheet
Tally Time: On the Farm
Kids help Minnie figure out how many pigs, sheep, and other animals live on the farm by reading the tables and counting up the tally marks.
First Grade
Data and Graphing
Worksheet
Histograms
Worksheet
Histograms
Sixth Grade
Data and Graphing
In this sixth-grade data and graphing worksheet, students will complete histograms from given data sets and frequency tables.
Worksheet
Histograms
Worksheet
Histograms
In this sixth-grade data and graphing worksheet, students will complete histograms from given data sets and frequency tables.
Sixth Grade
Data and Graphing
Worksheet
Dot Plots
Worksheet
Dot Plots
Sixth Grade
Data and Graphing
Covering a variety of interesting real-life contexts, this two-page math worksheet gives learners practice turning data sets into dot plots that are representative of each scenario.
Worksheet
Dot Plots
Worksheet
Dot Plots
Covering a variety of interesting real-life contexts, this two-page math worksheet gives learners practice turning data sets into dot plots that are representative of each scenario.
Sixth Grade
Data and Graphing
Worksheet
Drawing Inferences Using Data
Worksheet
Drawing Inferences Using Data
Seventh Grade
Data and Graphing
Students compare different survey methods to make inferences about how much time students at a school spend playing video games in this seventh-grade math worksheet.
Worksheet
Drawing Inferences Using Data
Worksheet
Drawing Inferences Using Data
Students compare different survey methods to make inferences about how much time students at a school spend playing video games in this seventh-grade math worksheet.
Seventh Grade
Data and Graphing
Worksheet
Sample Spaces of Compound Events
Worksheet
Sample Spaces of Compound Events
Seventh Grade
Data and Graphing
This seventh-grade math worksheet guides students through the process of finding the sample space of compound events.
Worksheet
Sample Spaces of Compound Events
Worksheet
Sample Spaces of Compound Events
This seventh-grade math worksheet guides students through the process of finding the sample space of compound events.
Seventh Grade
Data and Graphing
Worksheet
Reading Pictographs: Carrots for Bunnies
Worksheet
Reading Pictographs: Carrots for Bunnies
Third Grade
Data and Graphing
How many carrots did Sammy's pet bunny eat? Kids use information in the pictograph to answer word problems in this bunny-filled math worksheet.
Worksheet
Reading Pictographs: Carrots for Bunnies
Worksheet
Reading Pictographs: Carrots for Bunnies
How many carrots did Sammy's pet bunny eat? Kids use information in the pictograph to answer word problems in this bunny-filled math worksheet.
Third Grade
Data and Graphing
Worksheet
Math Table
Worksheet
Math Table
Second Grade
Data and Graphing
Help your second grader learn how to read a math table by using this math farm table to answer a set of questions.
Worksheet
Math Table
Worksheet
Math Table
Help your second grader learn how to read a math table by using this math farm table to answer a set of questions.
Second Grade
Data and Graphing
Worksheet
Graphing Data: Colors
Worksheet
Graphing Data: Colors
Second Grade
Data and Graphing
Help the concept of graphing really sink in by challenging your second grader to graph kids' favorite colors using a table, tally mark table, and grid.
Worksheet
Graphing Data: Colors
Worksheet
Graphing Data: Colors
Help the concept of graphing really sink in by challenging your second grader to graph kids' favorite colors using a table, tally mark table, and grid.
Second Grade
Data and Graphing
Worksheet
Comparing Pictographs: Taxi, Taxi
Worksheet
Comparing Pictographs: Taxi, Taxi
Third Grade
Addition
In this 3rd grade math worksheet, kids analyze and compare data in two pictographs in order to answer a set of word problems.
Worksheet
Comparing Pictographs: Taxi, Taxi
Worksheet
Comparing Pictographs: Taxi, Taxi
In this 3rd grade math worksheet, kids analyze and compare data in two pictographs in order to answer a set of word problems.
Third Grade
Addition
Worksheet
Reading Pictographs: Drink Your Milk!
Worksheet
Reading Pictographs: Drink Your Milk!
Third Grade
Data and Graphing
Can your child help Tommy figure out how much milk he drinks? As she does, she'll learn how to read and interpret data in graphs and practice multiplication.
Worksheet
Reading Pictographs: Drink Your Milk!
Worksheet
Reading Pictographs: Drink Your Milk!
Can your child help Tommy figure out how much milk he drinks? As she does, she'll learn how to read and interpret data in graphs and practice multiplication.
Third Grade
Data and Graphing
Worksheet
Tally Time: At the Farmers Market
Worksheet
Tally Time: At the Farmers Market
First Grade
Data and Graphing
The farmer needs help keeping track of his vegetables. Can your child use her counting skills to give him a hand?
Worksheet
Tally Time: At the Farmers Market
Worksheet
Tally Time: At the Farmers Market
The farmer needs help keeping track of his vegetables. Can your child use her counting skills to give him a hand?
First Grade
Data and Graphing
Worksheet
Box Plots #1
Interactive Worksheet
Box Plots #1
Sixth Grade
Data and Graphing
Practice interpreting box plots with this sixth-grade worksheet!
Interactive Worksheet
Box Plots #1
Interactive Worksheet
Box Plots #1
Practice interpreting box plots with this sixth-grade worksheet!
Sixth Grade
Data and Graphing
Interactive Worksheet
Create Histograms From Data Sets
Worksheet
Create Histograms From Data Sets
Sixth Grade
Data and Graphing
Draw data to show a scientist’s findings in this practical worksheet!
Worksheet
Create Histograms From Data Sets
Worksheet
Create Histograms From Data Sets
Draw data to show a scientist’s findings in this practical worksheet!
Sixth Grade
Data and Graphing
Worksheet
Let's Draw: Create Line Plots
Worksheet
Let's Draw: Create Line Plots
Sixth Grade
Data and Graphing
Use data from a farmers' market to create your own line plots in this sixth-grade worksheet!
Worksheet
Let's Draw: Create Line Plots
Worksheet
Let's Draw: Create Line Plots
Use data from a farmers' market to create your own line plots in this sixth-grade worksheet!
Sixth Grade
Data and Graphing
Worksheet
From Dot Plots to Histograms
Worksheet
From Dot Plots to Histograms
Sixth Grade
Data and Graphing
Discover different ways to display data in this delightful sixth-grade worksheet!
Worksheet
From Dot Plots to Histograms
Worksheet
From Dot Plots to Histograms
Discover different ways to display data in this delightful sixth-grade worksheet!
Sixth Grade
Data and Graphing
Worksheet
Experimental Probability
Worksheet
Experimental Probability
Seventh Grade
Data and Graphing
This seventh-grade math worksheet gives students a chance to find experimental probabilities using real-world scenarios in the form of word problems!
Worksheet
Experimental Probability
Worksheet
Experimental Probability
This seventh-grade math worksheet gives students a chance to find experimental probabilities using real-world scenarios in the form of word problems!
Seventh Grade
Data and Graphing
Worksheet
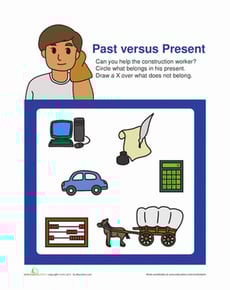
Past vs Present
Worksheet
Past vs Present
Kindergarten
Data and Graphing
Explore the concept of time with your little learner. Which of these items are from the present day? Which are from the past?
Worksheet
Past vs Present
Worksheet
Past vs Present
Explore the concept of time with your little learner. Which of these items are from the present day? Which are from the past?
Kindergarten
Data and Graphing
Worksheet
Bounce that Ball: Learn Math While Doing Sports
Activity
Bounce that Ball: Learn Math While Doing Sports
First Grade
Data and Graphing
Head out to the driveway, ball in hand, for a bouncing challenge. Then use those results to make a colorful graph that lets your child compare results.
Activity
Bounce that Ball: Learn Math While Doing Sports
Activity
Bounce that Ball: Learn Math While Doing Sports
Head out to the driveway, ball in hand, for a bouncing challenge. Then use those results to make a colorful graph that lets your child compare results.
First Grade
Data and Graphing
Activity
Summer Bar Graph
Activity
Summer Bar Graph
First Grade
Data and Graphing
Draw some educational value out of a summer stocked full of adventures!
Activity
Summer Bar Graph
Activity
Summer Bar Graph
Draw some educational value out of a summer stocked full of adventures!
First Grade
Data and Graphing
Activity
Dice Probability
Activity
Dice Probability
Fourth Grade
Data and Graphing
Analyze this simple betting game with your fourth grade student in order to discuss probability.
Activity
Dice Probability
Activity
Dice Probability
Analyze this simple betting game with your fourth grade student in order to discuss probability.
Fourth Grade
Data and Graphing
Activity
Pitch and Hit Data
Activity
Pitch and Hit Data
Third Grade
Data and Graphing
Okay, engaging in a graphing activity may sound ho-hum, but if you use fun data, it changes the picture entirely.
Activity
Pitch and Hit Data
Activity
Pitch and Hit Data
Okay, engaging in a graphing activity may sound ho-hum, but if you use fun data, it changes the picture entirely.
Third Grade
Data and Graphing
Activity
Flip a Coin
Activity
Flip a Coin
Kindergarten
Data and Graphing
Challenge your kindergartener to finding out if a coin toss is really fair by conducting this coin toss experiment.
Activity
Flip a Coin
Activity
Flip a Coin
Challenge your kindergartener to finding out if a coin toss is really fair by conducting this coin toss experiment.
Kindergarten
Data and Graphing
Activity
Leprechaun Chase
Activity
Leprechaun Chase
Fifth Grade
Geometry
This St. Patrick's day, stretch your child's social studies and math skills with this fun, cooperative learning game.
Activity
Leprechaun Chase
Activity
Leprechaun Chase
This St. Patrick's day, stretch your child's social studies and math skills with this fun, cooperative learning game.
Fifth Grade
Geometry
Activity
The Mean, Median, and Mode Card Game
Activity
The Mean, Median, and Mode Card Game
Fifth Grade
Data and Graphing
Want to ensure that your child's math knowledge stays sharp? This mean, median, and mode game is the perfect way to reinforce these essential math concepts.
Activity
The Mean, Median, and Mode Card Game
Activity
The Mean, Median, and Mode Card Game
Want to ensure that your child's math knowledge stays sharp? This mean, median, and mode game is the perfect way to reinforce these essential math concepts.
Fifth Grade
Data and Graphing
Activity
Let's Play Ball
Lesson Plan
Let's Play Ball
Third Grade
Multiplication
Students will have a ball with this data collection lesson plan where they learn about collecting and plotting data on a chart and line plot.
Lesson Plan
Let's Play Ball
Lesson Plan
Let's Play Ball
Students will have a ball with this data collection lesson plan where they learn about collecting and plotting data on a chart and line plot.
Third Grade
Multiplication
Lesson Plan
1
2