Data and Graphing Activities


About Data And Graphing Activities
On Education.com, data and graphing activities help students explore patterns, organize information, and analyze data through engaging exercises. These activities include sorting math manipulatives like Unifix cubes or counters into groups to create visual charts, making bar graphs with materials like colored snacks, and tracking classroom data with tally charts. Such exercises develop critical thinking, measurement skills, and an understanding of data representation in a hands-on way.
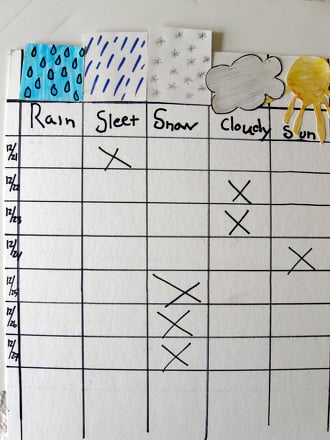
This page offers printable worksheets, interactive lessons, and guided activities centered on collecting, organizing, and plotting data. Students can practice making line graphs to track weather trends or create pictographs using everyday objects. Resources are designed to support educators and parents in teaching early data literacy with grade-specific challenges and engaging formats.
Using these practices at school or home, children combine mathematics, observation, and computational skills while building confidence in working with numbers. These resources make data analysis meaningful and accessible for young learners, setting the foundation for more advanced STEM concepts.