SKIP TO CONTENT
Worksheet Generator
Subjects
Grades
Worksheets
Games
Build a Worksheet
More Resources
Roly Recommends
Summer Boost
Subjects
Grades
Worksheets
Games
Build a Worksheet
More Resources
Roly Recommends
Summer Boost
Showing Results for and of 1 less
Filters
Math
Data and Graphing
46 results
Search for: and, of, 1, less
✕
Math
✕
1st - 3rd Grade
✕
Clear all
46 results
Subtopics:
Collecting and Organizing Data
Picture Graphs
Bar Graphs
Line Plots
Show Less
Filters
Search for: and, of, 1, less
✕
Math
✕
1st - 3rd Grade
✕
Subjects
Math
English Language Arts
Science
Social Studies
Foreign Language
Technology
Grade Level
Pre-K
K
1st
2nd
3rd
4th
5th
6th
7th
8th
Early Childhood
Elementary School
Middle School
Resource Type
Worksheets
Games
Lesson Plans
Activities
Exercises
Offline Games
Guided Lessons
Occasion
Birthdays
Summer
Halloween
Holidays
Hanukkah
Common Core
Yes
Game Type
Ball Games
Arts & Crafts
Arts & Crafts
Paper & Glue Crafts
English Language Support
Yes
Clear all
View 46 results
Showing Results for and of 1 less
Filters
46 results
Search for: and, of, 1, less
✕
Math
✕
1st - 3rd Grade
✕
Clear all
46 results
Less Than or Greater Than: 1 to 20
Game
Less Than or Greater Than: 1 to 20
First Grade
Numbers and Counting
The alligators are hungry for numbers, and kids use number skills to feed them.
Game
Less Than or Greater Than: 1 to 20
Game
Less Than or Greater Than: 1 to 20
The alligators are hungry for numbers, and kids use number skills to feed them.
First Grade
Numbers and Counting
Game
Data 1
Guided Lesson
Data 1
Third Grade
Fractions
Learning how to represent numerical information is a key part of the third grade math curriculum. This lesson in data provides guided instruction designed by our team of curriculum experts and teachers to present this concept in an engaging way. Not only that, but helpful exercises help kids to see the practical applicaton of these skills in the real world.
Guided Lesson
Data 1
Guided Lesson
Data 1
Learning how to represent numerical information is a key part of the third grade math curriculum. This lesson in data provides guided instruction designed by our team of curriculum experts and teachers to present this concept in an engaging way. Not only that, but helpful exercises help kids to see the practical applicaton of these skills in the real world.
Third Grade
Fractions
Guided Lesson
Measurement and Graphing 1
Exercise
Measurement and Graphing 1
Third Grade
Fractions
This exercise will introduce students to the concept of taking measurements and graphing the data.
Exercise
Measurement and Graphing 1
Exercise
Measurement and Graphing 1
This exercise will introduce students to the concept of taking measurements and graphing the data.
Third Grade
Fractions
Exercise
Probability and Statistics 1
Exercise
Probability and Statistics 1
Third Grade
Data and Graphing
This engaging exercise will introduce students to probability and statistics in a way that excites them to continue learning.
Exercise
Probability and Statistics 1
Exercise
Probability and Statistics 1
This engaging exercise will introduce students to probability and statistics in a way that excites them to continue learning.
Third Grade
Data and Graphing
Exercise
Collecting and Organizing Data 1
Exercise
Collecting and Organizing Data 1
Third Grade
Data and Graphing
Students will learn how to collect and organize data thanks to this interesting exercise from Education.com.
Exercise
Collecting and Organizing Data 1
Exercise
Collecting and Organizing Data 1
Students will learn how to collect and organize data thanks to this interesting exercise from Education.com.
Third Grade
Data and Graphing
Exercise
Practice Reading Venn Diagrams #1: Favorite Hobby
Worksheet
Practice Reading Venn Diagrams #1: Favorite Hobby
Second Grade
Data and Graphing
Kids practice reading a Venn diagram about favorite hobbies and answer questions about it in this 2nd grade math worksheet.
Worksheet
Practice Reading Venn Diagrams #1: Favorite Hobby
Worksheet
Practice Reading Venn Diagrams #1: Favorite Hobby
Kids practice reading a Venn diagram about favorite hobbies and answer questions about it in this 2nd grade math worksheet.
Second Grade
Data and Graphing
Worksheet
Pet Survey
Worksheet
Pet Survey
First Grade
Data and Graphing
Have your students survey one another about pet preferences using this interactive activity designed to practice representing and interpreting data.
Worksheet
Pet Survey
Worksheet
Pet Survey
Have your students survey one another about pet preferences using this interactive activity designed to practice representing and interpreting data.
First Grade
Data and Graphing
Worksheet
Ice Cream Bar Graph #5
Worksheet
Ice Cream Bar Graph #5
First Grade
Data and Graphing
Can you help Sam, Kate, and Becky keep track of ice cream sales? Get some practice with bar graphs, addition and subtraction all in one worksheet!
Worksheet
Ice Cream Bar Graph #5
Worksheet
Ice Cream Bar Graph #5
Can you help Sam, Kate, and Becky keep track of ice cream sales? Get some practice with bar graphs, addition and subtraction all in one worksheet!
First Grade
Data and Graphing
Worksheet
Create a Line Plot with Data Provided
Worksheet
Create a Line Plot with Data Provided
Third Grade
Data and Graphing
Use the data provided to have your students create a line plot that reflects how much TV watched per week for one third grade class.
Worksheet
Create a Line Plot with Data Provided
Worksheet
Create a Line Plot with Data Provided
Use the data provided to have your students create a line plot that reflects how much TV watched per week for one third grade class.
Third Grade
Data and Graphing
Worksheet
Draw a Birthday Bar Graph
Activity
Draw a Birthday Bar Graph
Third Grade
Data and Graphing
Liven up a lesson about graphing by helping your third grader compile a bar graph from his classmates' birthday data.
Activity
Draw a Birthday Bar Graph
Activity
Draw a Birthday Bar Graph
Liven up a lesson about graphing by helping your third grader compile a bar graph from his classmates' birthday data.
Third Grade
Data and Graphing
Activity
Do We Wear the Same Colors?
Activity
Do We Wear the Same Colors?
Third Grade
Data and Graphing
Hone observational skills and introduce the basics of data interpretation with this data gathering activity all about the different colors people wear.
Activity
Do We Wear the Same Colors?
Activity
Do We Wear the Same Colors?
Hone observational skills and introduce the basics of data interpretation with this data gathering activity all about the different colors people wear.
Third Grade
Data and Graphing
Activity
Different Types of Graphs: Picture and Bar Graphs
Worksheet
Different Types of Graphs: Picture and Bar Graphs
First Grade
Data and Graphing
Sure to test your kid's graphing skills, this graph worksheet features two different types of graphs and questions to go along with them.
Worksheet
Different Types of Graphs: Picture and Bar Graphs
Worksheet
Different Types of Graphs: Picture and Bar Graphs
Sure to test your kid's graphing skills, this graph worksheet features two different types of graphs and questions to go along with them.
First Grade
Data and Graphing
Worksheet
What Doesn't Belong? A Categorization Game
Activity
What Doesn't Belong? A Categorization Game
Third Grade
Data and Graphing
This educated-guessing game is great for preschoolers. This activity helps your child work on her reasoning skills.
Activity
What Doesn't Belong? A Categorization Game
Activity
What Doesn't Belong? A Categorization Game
This educated-guessing game is great for preschoolers. This activity helps your child work on her reasoning skills.
Third Grade
Data and Graphing
Activity
Study of Names
Activity
Study of Names
Third Grade
Data and Graphing
Graph are a great way to organize information. Your child will get to practice graphing by creating a bar graph and a pictorial graph of her friend's names.
Activity
Study of Names
Activity
Study of Names
Graph are a great way to organize information. Your child will get to practice graphing by creating a bar graph and a pictorial graph of her friend's names.
Third Grade
Data and Graphing
Activity
Comparing Pictographs: Taxi, Taxi
Worksheet
Comparing Pictographs: Taxi, Taxi
Third Grade
Addition
In this 3rd grade math worksheet, kids analyze and compare data in two pictographs in order to answer a set of word problems.
Worksheet
Comparing Pictographs: Taxi, Taxi
Worksheet
Comparing Pictographs: Taxi, Taxi
In this 3rd grade math worksheet, kids analyze and compare data in two pictographs in order to answer a set of word problems.
Third Grade
Addition
Worksheet
Probability Game
Activity
Probability Game
Third Grade
Data and Graphing
Probability can be a tough concept to master. Try playing this fun card game in order to help your third grader understand it a little better.
Activity
Probability Game
Activity
Probability Game
Probability can be a tough concept to master. Try playing this fun card game in order to help your third grader understand it a little better.
Third Grade
Data and Graphing
Activity
Math + Love = Valentine's Day Bar Graph
Lesson Plan
Math + Love = Valentine's Day Bar Graph
Second Grade
Data and Graphing
What's more romantic than a bar graph on Valentine's Day? In this Valentine's Day lesson plan, students will use information from a data set to create their own tally charts and bar graphs and then analyze these graphs to answer questions.
Lesson Plan
Math + Love = Valentine's Day Bar Graph
Lesson Plan
Math + Love = Valentine's Day Bar Graph
What's more romantic than a bar graph on Valentine's Day? In this Valentine's Day lesson plan, students will use information from a data set to create their own tally charts and bar graphs and then analyze these graphs to answer questions.
Second Grade
Data and Graphing
Lesson Plan
Household Energy Consumption
Activity
Household Energy Consumption
Third Grade
Multiplication
Challenge your third-grader to sharpen her new math skills--and maybe do the planet a favor, too.
Activity
Household Energy Consumption
Activity
Household Energy Consumption
Challenge your third-grader to sharpen her new math skills--and maybe do the planet a favor, too.
Third Grade
Multiplication
Activity
Track the Weather with Weather Charts
Activity
Track the Weather with Weather Charts
Third Grade
Measurement
Learn about the microclimate of your backyard by tracking rainfall, temperature, and observed weather with hand drawn charts and graphs.
Activity
Track the Weather with Weather Charts
Activity
Track the Weather with Weather Charts
Learn about the microclimate of your backyard by tracking rainfall, temperature, and observed weather with hand drawn charts and graphs.
Third Grade
Measurement
Activity
Make a Menorah Light Chart
Activity
Make a Menorah Light Chart
Second Grade
Data and Graphing
Your child can brush up on her math skills by charting the length of time that each candle on the menorah takes to burn.
Activity
Make a Menorah Light Chart
Activity
Make a Menorah Light Chart
Your child can brush up on her math skills by charting the length of time that each candle on the menorah takes to burn.
Second Grade
Data and Graphing
Activity
Make a Picture Graph
Worksheet
Make a Picture Graph
First Grade
Data and Graphing
In this math worksheet, children use picture graphs to tally up the total amounts of baked goods each party purchases.
Worksheet
Make a Picture Graph
Worksheet
Make a Picture Graph
In this math worksheet, children use picture graphs to tally up the total amounts of baked goods each party purchases.
First Grade
Data and Graphing
Worksheet
Ice Cream Bar Graph #10
Worksheet
Ice Cream Bar Graph #10
First Grade
Data and Graphing
Sam, Kate, and Becky need help keeping track of their ice cream sales. Practice using bar graphs, addition, and subtraction in this ice cream themed worksheet.
Worksheet
Ice Cream Bar Graph #10
Worksheet
Ice Cream Bar Graph #10
Sam, Kate, and Becky need help keeping track of their ice cream sales. Practice using bar graphs, addition, and subtraction in this ice cream themed worksheet.
First Grade
Data and Graphing
Worksheet
Ice Cream Graph #15
Worksheet
Ice Cream Graph #15
First Grade
Data and Graphing
Three kids set up an ice cream stand, but they need your child's help figuring out how much they sold. Help Sam, Kate, and Becky calculate their sales and more.
Worksheet
Ice Cream Graph #15
Worksheet
Ice Cream Graph #15
Three kids set up an ice cream stand, but they need your child's help figuring out how much they sold. Help Sam, Kate, and Becky calculate their sales and more.
First Grade
Data and Graphing
Worksheet
Ice Cream Graph #20
Worksheet
Ice Cream Graph #20
First Grade
Data and Graphing
Young entrepreneurs Sam, Kate, and Becky sold some ice cream cones, but they need help figuring out how many. Exercise pictograph skills in this worksheet.
Worksheet
Ice Cream Graph #20
Worksheet
Ice Cream Graph #20
Young entrepreneurs Sam, Kate, and Becky sold some ice cream cones, but they need help figuring out how many. Exercise pictograph skills in this worksheet.
First Grade
Data and Graphing
Worksheet
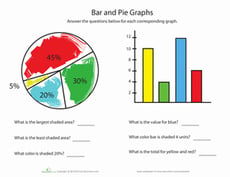
Practice Graphs
Worksheet
Practice Graphs
Second Grade
Data and Graphing
Kids practice representing a set of data using three kinds of graphs: a bar graph, pictograph, and pie graph.
Worksheet
Practice Graphs
Worksheet
Practice Graphs
Kids practice representing a set of data using three kinds of graphs: a bar graph, pictograph, and pie graph.
Second Grade
Data and Graphing
Worksheet
Practice Reading Venn Diagrams #3: Favorite Dessert
Worksheet
Practice Reading Venn Diagrams #3: Favorite Dessert
Second Grade
Data and Graphing
Kids practice reading a Venn diagram about favorite desserts and answer questions about it in this 2nd grade math worksheet.
Worksheet
Practice Reading Venn Diagrams #3: Favorite Dessert
Worksheet
Practice Reading Venn Diagrams #3: Favorite Dessert
Kids practice reading a Venn diagram about favorite desserts and answer questions about it in this 2nd grade math worksheet.
Second Grade
Data and Graphing
Worksheet
Mean, Median and Mode Madness!
Lesson Plan
Mean, Median and Mode Madness!
Third Grade
Data and Graphing
This lesson introduces students to the concepts of mean, median, and mode in a hands-on and visual way.
Lesson Plan
Mean, Median and Mode Madness!
Lesson Plan
Mean, Median and Mode Madness!
This lesson introduces students to the concepts of mean, median, and mode in a hands-on and visual way.
Third Grade
Data and Graphing
Lesson Plan
Reading Pictographs: Eggplant Cooking
Worksheet
Reading Pictographs: Eggplant Cooking
Third Grade
Data and Graphing
Mr. Chef keeps track of how many eggplants he uses with a pictograph. In this worksheet, kids use information in the pictograph to answer word problems.
Worksheet
Reading Pictographs: Eggplant Cooking
Worksheet
Reading Pictographs: Eggplant Cooking
Mr. Chef keeps track of how many eggplants he uses with a pictograph. In this worksheet, kids use information in the pictograph to answer word problems.
Third Grade
Data and Graphing
Worksheet
Using a Chart: Do Your Chores!
Worksheet
Using a Chart: Do Your Chores!
Third Grade
Data and Graphing
Kids completing this third grade math worksheet use a chart to compare data and solve addition problems.
Worksheet
Using a Chart: Do Your Chores!
Worksheet
Using a Chart: Do Your Chores!
Kids completing this third grade math worksheet use a chart to compare data and solve addition problems.
Third Grade
Data and Graphing
Worksheet
Practice Reading Venn Diagrams #2: In the Orchestra
Worksheet
Practice Reading Venn Diagrams #2: In the Orchestra
Second Grade
Data and Graphing
Kids practice reading a Venn diagram about instruments in an orchestra and answering questions about it in this 2nd grade math worksheet.
Worksheet
Practice Reading Venn Diagrams #2: In the Orchestra
Worksheet
Practice Reading Venn Diagrams #2: In the Orchestra
Kids practice reading a Venn diagram about instruments in an orchestra and answering questions about it in this 2nd grade math worksheet.
Second Grade
Data and Graphing
Worksheet
1
2