SKIP TO CONTENT
Worksheet Generator
Subjects
Grades
Worksheets
Games
Build a Worksheet
More Resources
Roly Recommends
Subjects
Grades
Worksheets
Games
Build a Worksheet
More Resources
Roly Recommends
All Subjects
Math
Data and Graphing
Subtopics:
Collecting and Organizing Data
Picture Graphs
Bar Graphs
Coordinate Plane
Show Less
Filters
Search for: and, counting, back
✕
Math
✕
2nd and 3rd Grade
✕
Subjects
Math
English Language Arts
Science
Social Studies
Foreign Language
Grade Level
Pre-K
K
1st
2nd
3rd
4th
5th
6th
7th
8th
Early Childhood
Elementary School
Middle School
Resource Type
Worksheets
Games
Lesson Plans
Activities
Occasion
Birthdays
St. Patrick's Day
Summer
Holidays
Hanukkah
Common Core
Yes
English Language Support
Yes
See More
Clear All
View 26 results
Showing Results for and counting back
26 results
Search for: and, counting, back
✕
Math
✕
2nd and 3rd Grade
✕
Clear All
Sort by:
Relevance
Most recent
Most popular
Alphabetical A-Z
Alphabetical Z-A
All filters
26 results
Sort by:
Relevance
Most recent
Most popular
Alphabetical A-Z
Alphabetical Z-A
Make a Bar Graph: Bake Sale
Worksheet
Make a Bar Graph: Bake Sale
Third Grade
Data and Graphing
Debbie and Elizabeth need help counting their cookie sales! Give your student practice making graphs and using them to calculate a sum.
Worksheet
Make a Bar Graph: Bake Sale
Worksheet
Make a Bar Graph: Bake Sale
Debbie and Elizabeth need help counting their cookie sales! Give your student practice making graphs and using them to calculate a sum.
Third Grade
Data and Graphing
Worksheet
Probability Introduction
Worksheet
Probability Introduction
Third Grade
Data and Graphing
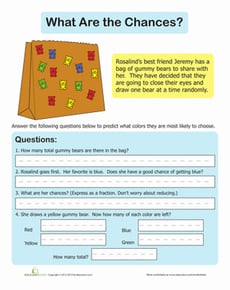
What are the odds? Kids will learn about the important concept of probability by counting gummy bears in a bag. Which color is most likely to be picked?
Worksheet
Probability Introduction
Worksheet
Probability Introduction
What are the odds? Kids will learn about the important concept of probability by counting gummy bears in a bag. Which color is most likely to be picked?
Third Grade
Data and Graphing
Worksheet
Bar Graphs: Favorite Drink
Worksheet
Bar Graphs: Favorite Drink
Second Grade
Data and Graphing
Which drink is most popular? Get your student ready for graphing with this fun bar graphing worksheet!
Worksheet
Bar Graphs: Favorite Drink
Worksheet
Bar Graphs: Favorite Drink
Which drink is most popular? Get your student ready for graphing with this fun bar graphing worksheet!
Second Grade
Data and Graphing
Worksheet
Bar Graphs
Worksheet
Bar Graphs
Second Grade
Data and Graphing
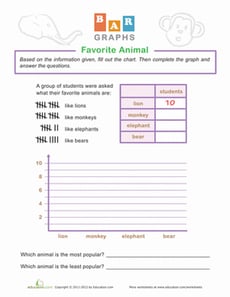
What is the class's favorite animal? Get your student ready for graphing with this fun bar graph worksheet!
Worksheet
Bar Graphs
Worksheet
Bar Graphs
What is the class's favorite animal? Get your student ready for graphing with this fun bar graph worksheet!
Second Grade
Data and Graphing
Worksheet
Bar Graphs: School Subjects
Worksheet
Bar Graphs: School Subjects
Second Grade
Data and Graphing
Math students, get ready to graph! Here is a great worksheet that will help your student practice making bar graphs from information provided.
Worksheet
Bar Graphs: School Subjects
Worksheet
Bar Graphs: School Subjects
Math students, get ready to graph! Here is a great worksheet that will help your student practice making bar graphs from information provided.
Second Grade
Data and Graphing
Worksheet
Bar Graphs: Favorite Sport
Worksheet
Bar Graphs: Favorite Sport
Second Grade
Data and Graphing
Math buffs and sports buffs alike, here's a great intro to graphing worksheet! Your student will get practice making bar graphs from provided data.
Worksheet
Bar Graphs: Favorite Sport
Worksheet
Bar Graphs: Favorite Sport
Math buffs and sports buffs alike, here's a great intro to graphing worksheet! Your student will get practice making bar graphs from provided data.
Second Grade
Data and Graphing
Worksheet
Bar Graphing with Roly
Game
Bar Graphing with Roly
Second Grade
Data and Graphing
Stop those germs! Kids must catch germs as they drop and prevent people from getting sick in this icky data and graphing game.
Game
Bar Graphing with Roly
Game
Bar Graphing with Roly
Stop those germs! Kids must catch germs as they drop and prevent people from getting sick in this icky data and graphing game.
Second Grade
Data and Graphing
Game
Bar Graphs: Favorite Season
Worksheet
Bar Graphs: Favorite Season
Second Grade
Data and Graphing
Which season of the year is the best? Get your student ready for graphing with this fun bar graph worksheet!
Worksheet
Bar Graphs: Favorite Season
Worksheet
Bar Graphs: Favorite Season
Which season of the year is the best? Get your student ready for graphing with this fun bar graph worksheet!
Second Grade
Data and Graphing
Worksheet
Bar Graphs: Favorite Fruit
Worksheet
Bar Graphs: Favorite Fruit
Second Grade
Data and Graphing
Bar graphing buffs, here is a fun worksheet for you and your students! Give them some practice making a bar graph from the data provided.
Worksheet
Bar Graphs: Favorite Fruit
Worksheet
Bar Graphs: Favorite Fruit
Bar graphing buffs, here is a fun worksheet for you and your students! Give them some practice making a bar graph from the data provided.
Second Grade
Data and Graphing
Worksheet
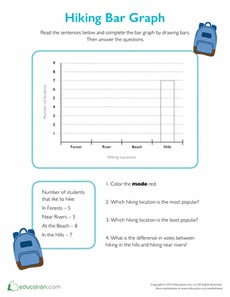
Bar Graph for Kids: Hiking Spots
Worksheet
Bar Graph for Kids: Hiking Spots
Second Grade
Data and Graphing
Before putting on those hiking boots, you might want to find out which spots are the most popular. Grab a red crayon and complete this bar graph.
Worksheet
Bar Graph for Kids: Hiking Spots
Worksheet
Bar Graph for Kids: Hiking Spots
Before putting on those hiking boots, you might want to find out which spots are the most popular. Grab a red crayon and complete this bar graph.
Second Grade
Data and Graphing
Worksheet
A Slice of the Fair: Pie Chart for Kids
Worksheet
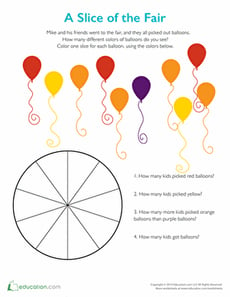
A Slice of the Fair: Pie Chart for Kids
Second Grade
Data and Graphing
Who doesn't love a slice of pie and balloons? Color the different slices in this pie chart for kids to learn more about graphing.
Worksheet
A Slice of the Fair: Pie Chart for Kids
Worksheet
A Slice of the Fair: Pie Chart for Kids
Who doesn't love a slice of pie and balloons? Color the different slices in this pie chart for kids to learn more about graphing.
Second Grade
Data and Graphing
Worksheet
Tally Marks: Keep the Count!
Worksheet
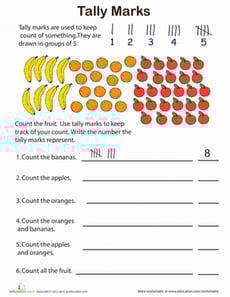
Tally Marks: Keep the Count!
Second Grade
Data and Graphing
Help your second grader practice using tally marks with this worksheet, and next family game night, she can keep score!
Worksheet
Tally Marks: Keep the Count!
Worksheet
Tally Marks: Keep the Count!
Help your second grader practice using tally marks with this worksheet, and next family game night, she can keep score!
Second Grade
Data and Graphing
Worksheet
BBQ Food: Venn Diagram for Kids
Worksheet
BBQ Food: Venn Diagram for Kids
Second Grade
Data and Graphing
Do you have a favorite BBQ food? Find out how to keep track of your friends' favorite foods with this Venn diagram for kids.
Worksheet
BBQ Food: Venn Diagram for Kids
Worksheet
BBQ Food: Venn Diagram for Kids
Do you have a favorite BBQ food? Find out how to keep track of your friends' favorite foods with this Venn diagram for kids.
Second Grade
Data and Graphing
Worksheet
Collecting Data
Worksheet
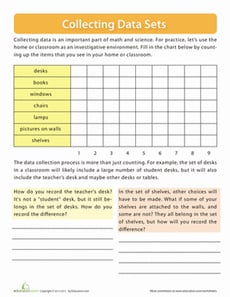
Collecting Data
Third Grade
Data and Graphing
Collecting data is an important part of math and statistics. Practice gathering data using items around the house or classroom!
Worksheet
Collecting Data
Worksheet
Collecting Data
Collecting data is an important part of math and statistics. Practice gathering data using items around the house or classroom!
Third Grade
Data and Graphing
Worksheet
Hiking Buddies Pictograph
Worksheet
Hiking Buddies Pictograph
Second Grade
Data and Graphing
This pictograph shows how many hikes Eric and his friends went on this month. Use the information to answer questions and determine who hiked the most.
Worksheet
Hiking Buddies Pictograph
Worksheet
Hiking Buddies Pictograph
This pictograph shows how many hikes Eric and his friends went on this month. Use the information to answer questions and determine who hiked the most.
Second Grade
Data and Graphing
Worksheet
How to Make a Bar Graph with BBQ Food
Worksheet
How to Make a Bar Graph with BBQ Food
Second Grade
Data and Graphing
Great food never goes out of style. Find out what the most popular barbecue foods are with this bar graph that teaches kids how to interpret data.
Worksheet
How to Make a Bar Graph with BBQ Food
Worksheet
How to Make a Bar Graph with BBQ Food
Great food never goes out of style. Find out what the most popular barbecue foods are with this bar graph that teaches kids how to interpret data.
Second Grade
Data and Graphing
Worksheet
Creating a Bar Graph: Favorite Picnic Spots
Worksheet
Creating a Bar Graph: Favorite Picnic Spots
Second Grade
Data and Graphing
Learners practice charting and graphing data in this hands-on worksheet.
Worksheet
Creating a Bar Graph: Favorite Picnic Spots
Worksheet
Creating a Bar Graph: Favorite Picnic Spots
Learners practice charting and graphing data in this hands-on worksheet.
Second Grade
Data and Graphing
Worksheet
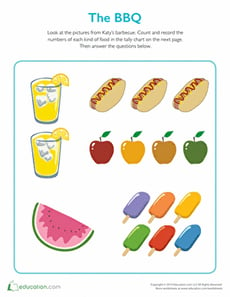
The BBQ Tally
Worksheet
The BBQ Tally
Second Grade
Data and Graphing
Your student will use the colorful pictures to count the number of food items that were consumed and record the information using the tally chart provided.
Worksheet
The BBQ Tally
Worksheet
The BBQ Tally
Your student will use the colorful pictures to count the number of food items that were consumed and record the information using the tally chart provided.
Second Grade
Data and Graphing
Worksheet
Using Election Data
Worksheet
Using Election Data
Second Grade
Data and Graphing
Practice reading election data with this data analysis worksheet!
Worksheet
Using Election Data
Worksheet
Using Election Data
Practice reading election data with this data analysis worksheet!
Second Grade
Data and Graphing
Worksheet
Let's Graph Our Fall Favorites!
Lesson Plan
Let's Graph Our Fall Favorites!
Second Grade
Data and Graphing
This engaging math lesson combines all of your kid's fall favorites as they learn to represent data using a bar graph.
Lesson Plan
Let's Graph Our Fall Favorites!
Lesson Plan
Let's Graph Our Fall Favorites!
This engaging math lesson combines all of your kid's fall favorites as they learn to represent data using a bar graph.
Second Grade
Data and Graphing
Lesson Plan
Graph Money
Activity
Graph Money
Second Grade
Data and Graphing
Give your smart second grader a rich challenge with this activity that combines graphing practice with money!
Activity
Graph Money
Activity
Graph Money
Give your smart second grader a rich challenge with this activity that combines graphing practice with money!
Second Grade
Data and Graphing
Activity
Make a Menorah Light Chart
Activity
Make a Menorah Light Chart
Second Grade
Data and Graphing
Your child can brush up on her math skills by charting the length of time that each candle on the menorah takes to burn.
Activity
Make a Menorah Light Chart
Activity
Make a Menorah Light Chart
Your child can brush up on her math skills by charting the length of time that each candle on the menorah takes to burn.
Second Grade
Data and Graphing
Activity
Household Energy Consumption
Activity
Household Energy Consumption
Third Grade
Multiplication
Challenge your third-grader to sharpen her new math skills--and maybe do the planet a favor, too.
Activity
Household Energy Consumption
Activity
Household Energy Consumption
Challenge your third-grader to sharpen her new math skills--and maybe do the planet a favor, too.
Third Grade
Multiplication
Activity
Leprechaun Chase
Activity
Leprechaun Chase
Third Grade
Geometry
This St. Patrick's day, stretch your third grader's social studies and math skills with this fun, cooperative learning game.
Activity
Leprechaun Chase
Activity
Leprechaun Chase
This St. Patrick's day, stretch your third grader's social studies and math skills with this fun, cooperative learning game.
Third Grade
Geometry
Activity
Draw a Birthday Bar Graph
Activity
Draw a Birthday Bar Graph
Third Grade
Data and Graphing
Liven up a lesson about graphing by helping your third grader compile a bar graph from his classmates' birthday data.
Activity
Draw a Birthday Bar Graph
Activity
Draw a Birthday Bar Graph
Liven up a lesson about graphing by helping your third grader compile a bar graph from his classmates' birthday data.
Third Grade
Data and Graphing
Activity
What is it Telling Me? Creating and Interpreting Line Plots
Lesson Plan
What is it Telling Me? Creating and Interpreting Line Plots
Third Grade
Data and Graphing
Line plots are a great way to introduce your students to graphing data. In this lesson, your students will learn how to create a line plot and also practice interpreting line plots.
Lesson Plan
What is it Telling Me? Creating and Interpreting Line Plots
Lesson Plan
What is it Telling Me? Creating and Interpreting Line Plots
Line plots are a great way to introduce your students to graphing data. In this lesson, your students will learn how to create a line plot and also practice interpreting line plots.
Third Grade
Data and Graphing
Lesson Plan
1