SKIP TO CONTENT
Worksheet Generator
Subjects
Grades
Worksheets
Games
Build a Worksheet
More Resources
Roly Recommends
Summer Boost
Subjects
Grades
Worksheets
Games
Build a Worksheet
More Resources
Roly Recommends
Summer Boost
Showing Results for and on
Filters
Math
Data and Graphing
165 results
Search for: and, on
✕
Math
✕
2nd - 4th Grade
✕
Clear all
165 results
Subtopics:
Collecting and Organizing Data
Picture Graphs
Bar Graphs
Line Plots
Show Less
Filters
Search for: and, on
✕
Math
✕
2nd - 4th Grade
✕
Subjects
Math
English Language Arts
Science
Social Studies
Foreign Language
Technology
Grade Level
Pre-K
K
1st
2nd
3rd
4th
5th
6th
7th
8th
Early Childhood
Elementary School
Middle School
Resource Type
Worksheets
Games
Lesson Plans
Interactive Worksheets
Workbooks
Activities
Exercises
Offline Games
Guided Lessons
Occasion
Birthdays
Summer
Back to School
Halloween
Winter
Holidays
Hanukkah
Valentine's Day
Common Core
Yes
English Language Support
Yes
Clear all
View 165 results
Showing Results for and on
Filters
165 results
Search for: and, on
✕
Math
✕
2nd - 4th Grade
✕
Clear all
165 results
Data and Graphing
Workbook
Data and Graphing
Third Grade
Data and Graphing
Become a master of analysis! In this series, kids practice collecting, creating and plotting data on graphs. Then they'll practice reading graphs, making predictions, and comparing data.
Workbook
Data and Graphing
Workbook
Data and Graphing
Become a master of analysis! In this series, kids practice collecting, creating and plotting data on graphs. Then they'll practice reading graphs, making predictions, and comparing data.
Third Grade
Data and Graphing
Workbook
Mean, Median and Mode Madness!
Lesson Plan
Mean, Median and Mode Madness!
Third Grade
Data and Graphing
This lesson introduces students to the concepts of mean, median, and mode in a hands-on and visual way.
Lesson Plan
Mean, Median and Mode Madness!
Lesson Plan
Mean, Median and Mode Madness!
This lesson introduces students to the concepts of mean, median, and mode in a hands-on and visual way.
Third Grade
Data and Graphing
Lesson Plan
Zap and Kreb: Graphing Word Problems
Game
Zap and Kreb: Graphing Word Problems
Third Grade
Data and Graphing
Kids journey to Earth with aliens Zap and Kreb on a mission to gather data and create graphs in a math story that's out of this world!
Game
Zap and Kreb: Graphing Word Problems
Game
Zap and Kreb: Graphing Word Problems
Kids journey to Earth with aliens Zap and Kreb on a mission to gather data and create graphs in a math story that's out of this world!
Third Grade
Data and Graphing
Game
Measurement and Data 4
Guided Lesson
Measurement and Data 4
Fourth Grade
Fractions
Representing data on graphs makes math visual and involves some creativity and design. Plotting data using fractional units takes their learning one step further. Also in this unit, students learn to measure using both traditional units (like inches, feet and yards) and metric units, and how to convert measurements within each system. The concept of measurement gets two dimensional when students explore measuring and working with angles.
Guided Lesson
Measurement and Data 4
Guided Lesson
Measurement and Data 4
Representing data on graphs makes math visual and involves some creativity and design. Plotting data using fractional units takes their learning one step further. Also in this unit, students learn to measure using both traditional units (like inches, feet and yards) and metric units, and how to convert measurements within each system. The concept of measurement gets two dimensional when students explore measuring and working with angles.
Fourth Grade
Fractions
Guided Lesson
Line Plots and Unit Fractions
Exercise
Line Plots and Unit Fractions
Fourth Grade
Fractions
Understanding unit fractions is a lot easier with this exercise that lays out all out on line plots.
Exercise
Line Plots and Unit Fractions
Exercise
Line Plots and Unit Fractions
Understanding unit fractions is a lot easier with this exercise that lays out all out on line plots.
Fourth Grade
Fractions
Exercise
Mighty Mean, Median, and Mode
Lesson Plan
Mighty Mean, Median, and Mode
Fourth Grade
Data and Graphing
Give your students a good basis in interpreting data with this lesson that teaches them about mean, median, and mode with plenty of practice and cute videos to keep them interested.
Lesson Plan
Mighty Mean, Median, and Mode
Lesson Plan
Mighty Mean, Median, and Mode
Give your students a good basis in interpreting data with this lesson that teaches them about mean, median, and mode with plenty of practice and cute videos to keep them interested.
Fourth Grade
Data and Graphing
Lesson Plan
Measurement and Graphing 1
Exercise
Measurement and Graphing 1
Third Grade
Fractions
This exercise will introduce students to the concept of taking measurements and graphing the data.
Exercise
Measurement and Graphing 1
Exercise
Measurement and Graphing 1
This exercise will introduce students to the concept of taking measurements and graphing the data.
Third Grade
Fractions
Exercise
Probability and Statistics 1
Exercise
Probability and Statistics 1
Third Grade
Data and Graphing
This engaging exercise will introduce students to probability and statistics in a way that excites them to continue learning.
Exercise
Probability and Statistics 1
Exercise
Probability and Statistics 1
This engaging exercise will introduce students to probability and statistics in a way that excites them to continue learning.
Third Grade
Data and Graphing
Exercise
Probability and Statistics 2
Exercise
Probability and Statistics 2
Fourth Grade
Data and Graphing
Continue the probability and statistics fun with this involving exercise that shows students how to use data to make predictions.
Exercise
Probability and Statistics 2
Exercise
Probability and Statistics 2
Continue the probability and statistics fun with this involving exercise that shows students how to use data to make predictions.
Fourth Grade
Data and Graphing
Exercise
Stem and Leaf Plot
Worksheet
Stem and Leaf Plot
Third Grade
Data and Graphing
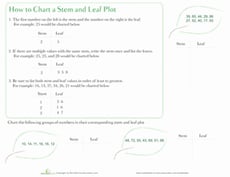
Nature is all around you -- even in your math textbooks! Get to the bottom of stem and leaf plots with this helpful worksheet.
Worksheet
Stem and Leaf Plot
Worksheet
Stem and Leaf Plot
Nature is all around you -- even in your math textbooks! Get to the bottom of stem and leaf plots with this helpful worksheet.
Third Grade
Data and Graphing
Worksheet
Creating a Bar Graph: Favorite Picnic Spots
Worksheet
Creating a Bar Graph: Favorite Picnic Spots
Second Grade
Data and Graphing
Learners practice charting and graphing data in this hands-on worksheet.
Worksheet
Creating a Bar Graph: Favorite Picnic Spots
Worksheet
Creating a Bar Graph: Favorite Picnic Spots
Learners practice charting and graphing data in this hands-on worksheet.
Second Grade
Data and Graphing
Worksheet
Collecting and Organizing Data 2
Exercise
Collecting and Organizing Data 2
Fourth Grade
Data and Graphing
Your students will grow adept at collecting and organizing data around them with this engaging exercise.
Exercise
Collecting and Organizing Data 2
Exercise
Collecting and Organizing Data 2
Your students will grow adept at collecting and organizing data around them with this engaging exercise.
Fourth Grade
Data and Graphing
Exercise
Collecting and Organizing Data 1
Exercise
Collecting and Organizing Data 1
Third Grade
Data and Graphing
Students will learn how to collect and organize data thanks to this interesting exercise from Education.com.
Exercise
Collecting and Organizing Data 1
Exercise
Collecting and Organizing Data 1
Students will learn how to collect and organize data thanks to this interesting exercise from Education.com.
Third Grade
Data and Graphing
Exercise
Comparing Pictographs: Tulips and Daisies
Worksheet
Comparing Pictographs: Tulips and Daisies
Second Grade
Data and Graphing
Your child will use the data in two pictographs that show the number of tulips and daisies imported from certain European countries to answer word problems.
Worksheet
Comparing Pictographs: Tulips and Daisies
Worksheet
Comparing Pictographs: Tulips and Daisies
Your child will use the data in two pictographs that show the number of tulips and daisies imported from certain European countries to answer word problems.
Second Grade
Data and Graphing
Worksheet
Beginning Bar Graphs: Favorite Sports
Worksheet
Beginning Bar Graphs: Favorite Sports
First Grade
Data and Graphing
This worksheet is a fun, hands on way to practice beginning data and graphing skills.
Worksheet
Beginning Bar Graphs: Favorite Sports
Worksheet
Beginning Bar Graphs: Favorite Sports
This worksheet is a fun, hands on way to practice beginning data and graphing skills.
First Grade
Data and Graphing
Worksheet
Pitch and Hit Data
Activity
Pitch and Hit Data
Third Grade
Data and Graphing
Okay, engaging in a graphing activity may sound ho-hum, but if you use fun data, it changes the picture entirely.
Activity
Pitch and Hit Data
Activity
Pitch and Hit Data
Okay, engaging in a graphing activity may sound ho-hum, but if you use fun data, it changes the picture entirely.
Third Grade
Data and Graphing
Activity
Let's Play Ball
Lesson Plan
Let's Play Ball
Third Grade
Multiplication
Students will have a ball with this data collection lesson plan where they learn about collecting and plotting data on a chart and line plot.
Lesson Plan
Let's Play Ball
Lesson Plan
Let's Play Ball
Students will have a ball with this data collection lesson plan where they learn about collecting and plotting data on a chart and line plot.
Third Grade
Multiplication
Lesson Plan
Hiking Buddies Pictograph
Worksheet
Hiking Buddies Pictograph
Second Grade
Data and Graphing
This pictograph shows how many hikes Eric and his friends went on this month. Use the information to answer questions and determine who hiked the most.
Worksheet
Hiking Buddies Pictograph
Worksheet
Hiking Buddies Pictograph
This pictograph shows how many hikes Eric and his friends went on this month. Use the information to answer questions and determine who hiked the most.
Second Grade
Data and Graphing
Worksheet
Jake's Nature Hike
Worksheet
Jake's Nature Hike
Second Grade
Data and Graphing
How many animals have you seen on your hikes? Jake saw many animals on his! Create your own bar graph with the information given.
Worksheet
Jake's Nature Hike
Worksheet
Jake's Nature Hike
How many animals have you seen on your hikes? Jake saw many animals on his! Create your own bar graph with the information given.
Second Grade
Data and Graphing
Worksheet
Make a Menorah Light Chart
Activity
Make a Menorah Light Chart
Second Grade
Data and Graphing
Your child can brush up on her math skills by charting the length of time that each candle on the menorah takes to burn.
Activity
Make a Menorah Light Chart
Activity
Make a Menorah Light Chart
Your child can brush up on her math skills by charting the length of time that each candle on the menorah takes to burn.
Second Grade
Data and Graphing
Activity
Lemonade Stand Pictograph
Worksheet
Lemonade Stand Pictograph
Second Grade
Data and Graphing
See how Susie's lemonade stand is doing! Students will learn how to analyze and compare data by answering questions based on the two pictographs.
Worksheet
Lemonade Stand Pictograph
Worksheet
Lemonade Stand Pictograph
See how Susie's lemonade stand is doing! Students will learn how to analyze and compare data by answering questions based on the two pictographs.
Second Grade
Data and Graphing
Worksheet
Line Graph
Worksheet
Line Graph
Third Grade
Data and Graphing
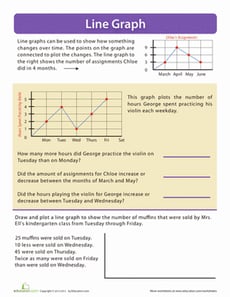
Introduce your math whiz to line graphs with this comprehensive lesson. Kids will read information on a line graph and plot some data as well.
Worksheet
Line Graph
Worksheet
Line Graph
Introduce your math whiz to line graphs with this comprehensive lesson. Kids will read information on a line graph and plot some data as well.
Third Grade
Data and Graphing
Worksheet
Comparing Pictographs: Football Time
Worksheet
Comparing Pictographs: Football Time
Third Grade
Data and Graphing
In this math worksheet, kids compare two pictographs that record the number of footballs kicked and the number of footballs thrown on the field.
Worksheet
Comparing Pictographs: Football Time
Worksheet
Comparing Pictographs: Football Time
In this math worksheet, kids compare two pictographs that record the number of footballs kicked and the number of footballs thrown on the field.
Third Grade
Data and Graphing
Worksheet
What is it Telling Me? Creating and Interpreting Line Plots
Lesson Plan
What is it Telling Me? Creating and Interpreting Line Plots
Third Grade
Data and Graphing
Line plots are a great way to introduce your students to graphing data. In this lesson, your students will learn how to create a line plot and also practice interpreting line plots.
Lesson Plan
What is it Telling Me? Creating and Interpreting Line Plots
Lesson Plan
What is it Telling Me? Creating and Interpreting Line Plots
Line plots are a great way to introduce your students to graphing data. In this lesson, your students will learn how to create a line plot and also practice interpreting line plots.
Third Grade
Data and Graphing
Lesson Plan
In the Band Pie Graph
Worksheet
In the Band Pie Graph
Second Grade
Data and Graphing
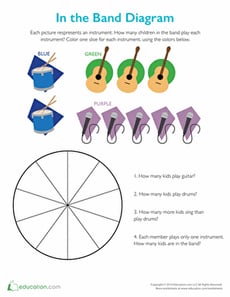
Rock out with this pie chart! Enjoy learning how to make a pie graph and interpret data while answering questions based on the information given.
Worksheet
In the Band Pie Graph
Worksheet
In the Band Pie Graph
Rock out with this pie chart! Enjoy learning how to make a pie graph and interpret data while answering questions based on the information given.
Second Grade
Data and Graphing
Worksheet
Bar Graph for Kids: Hiking Spots
Worksheet
Bar Graph for Kids: Hiking Spots
Second Grade
Data and Graphing
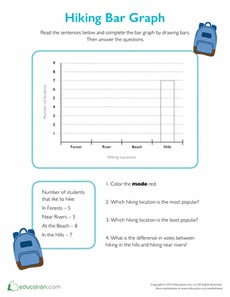
Before putting on those hiking boots, you might want to find out which spots are the most popular. Grab a red crayon and complete this bar graph.
Worksheet
Bar Graph for Kids: Hiking Spots
Worksheet
Bar Graph for Kids: Hiking Spots
Before putting on those hiking boots, you might want to find out which spots are the most popular. Grab a red crayon and complete this bar graph.
Second Grade
Data and Graphing
Worksheet
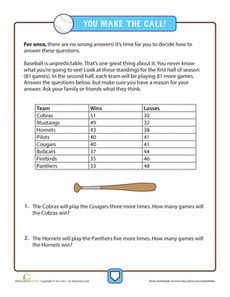
Baseball Predictions
Worksheet
Baseball Predictions
Fourth Grade
Data and Graphing
A math challenge worksheet with no wrong answers! Look at standings for a baseball league and make predictions based on numbers.
Worksheet
Baseball Predictions
Worksheet
Baseball Predictions
A math challenge worksheet with no wrong answers! Look at standings for a baseball league and make predictions based on numbers.
Fourth Grade
Data and Graphing
Worksheet
Pictograph Graph: Mr. Postman
Worksheet
Pictograph Graph: Mr. Postman
Second Grade
Data and Graphing
Boost your child's data know-how with a lesson on reading and understanding a math pictograph, a kind of graph in which pictures stand in for number data.
Worksheet
Pictograph Graph: Mr. Postman
Worksheet
Pictograph Graph: Mr. Postman
Boost your child's data know-how with a lesson on reading and understanding a math pictograph, a kind of graph in which pictures stand in for number data.
Second Grade
Data and Graphing
Worksheet
Create a Family Graph!
Activity
Create a Family Graph!
Third Grade
Data and Graphing
Create a graph based on the interests of family member's to see who has what in common. Your child will practice her math skills and get to know the family!
Activity
Create a Family Graph!
Activity
Create a Family Graph!
Create a graph based on the interests of family member's to see who has what in common. Your child will practice her math skills and get to know the family!
Third Grade
Data and Graphing
Activity
Math + Love = Valentine's Day Bar Graph
Lesson Plan
Math + Love = Valentine's Day Bar Graph
Second Grade
Data and Graphing
What's more romantic than a bar graph on Valentine's Day? In this Valentine's Day lesson plan, students will use information from a data set to create their own tally charts and bar graphs and then analyze these graphs to answer questions.
Lesson Plan
Math + Love = Valentine's Day Bar Graph
Lesson Plan
Math + Love = Valentine's Day Bar Graph
What's more romantic than a bar graph on Valentine's Day? In this Valentine's Day lesson plan, students will use information from a data set to create their own tally charts and bar graphs and then analyze these graphs to answer questions.
Second Grade
Data and Graphing
Lesson Plan
1
2
3
4
5
6