SKIP TO CONTENT
Worksheet Generator
Subjects
Grades
Worksheets
Games
Build a Worksheet
More Resources
Roly Recommends
Summer Boost
Subjects
Grades
Worksheets
Games
Build a Worksheet
More Resources
Roly Recommends
Summer Boost
Showing Results for interpreting graphs : Page 4
Filters
Math
161 results
Search for: interpreting, graphs
✕
Math
✕
Common Core
✕
Clear all
161 results
Subtopics:
Addition
Numbers and Counting
Place Value
Mixed Operations
Fractions
Decimals
Time and Money
Ratios and Proportions
Algebra
Geometry
Measurement
Data and Graphing
Statistics
Show Less
Filters
Search for: interpreting, graphs
✕
Math
✕
Common Core
✕
Subjects
Math
English Language Arts
Science
Social Studies
Grade Level
Pre-K
K
1st
2nd
3rd
4th
5th
6th
7th
8th
Early Childhood
Elementary School
Middle School
Resource Type
Worksheets
Games
Lesson Plans
Interactive Worksheets
Workbooks
Activities
Exercises
Teacher Resources
Occasion
Summer
Back to School
Fall
Holidays
Valentine's Day
Common Core
Yes
English Language Support
Yes
Clear all
View 161 results
Showing Results for interpreting graphs : Page 4
Filters
161 results
Search for: interpreting, graphs
✕
Math
✕
Common Core
✕
Clear all
161 results
Interpreting Slopes and y-Intercepts of Lines of Best Fit
Worksheet
Interpreting Slopes and y-Intercepts of Lines of Best Fit
Eighth Grade
Algebra
Students interpret slopes and
y
-intercepts of lines of best fit based on real-world scenarios in this eighth-grade worksheet!
Worksheet
Interpreting Slopes and y-Intercepts of Lines of Best Fit
Worksheet
Interpreting Slopes and y-Intercepts of Lines of Best Fit
Students interpret slopes and
y
-intercepts of lines of best fit based on real-world scenarios in this eighth-grade worksheet!
Eighth Grade
Algebra
Worksheet
Mighty Mean, Median, and Mode
Lesson Plan
Mighty Mean, Median, and Mode
Fourth Grade
Data and Graphing
Give your students a good basis in interpreting data with this lesson that teaches them about mean, median, and mode with plenty of practice and cute videos to keep them interested.
Lesson Plan
Mighty Mean, Median, and Mode
Lesson Plan
Mighty Mean, Median, and Mode
Give your students a good basis in interpreting data with this lesson that teaches them about mean, median, and mode with plenty of practice and cute videos to keep them interested.
Fourth Grade
Data and Graphing
Lesson Plan
Reading Pictographs: Carrots for Bunnies
Worksheet
Reading Pictographs: Carrots for Bunnies
Third Grade
Data and Graphing
How many carrots did Sammy's pet bunny eat? Kids use information in the pictograph to answer word problems in this bunny-filled math worksheet.
Worksheet
Reading Pictographs: Carrots for Bunnies
Worksheet
Reading Pictographs: Carrots for Bunnies
How many carrots did Sammy's pet bunny eat? Kids use information in the pictograph to answer word problems in this bunny-filled math worksheet.
Third Grade
Data and Graphing
Worksheet
Reading Pictographs: Tomato Fest!
Worksheet
Reading Pictographs: Tomato Fest!
Third Grade
Data and Graphing
The farmers are busy picking tomatoes! Kids practice reading a pictograph to help Mr. Farmer figure out how many tomatoes he picked in this worksheet.
Worksheet
Reading Pictographs: Tomato Fest!
Worksheet
Reading Pictographs: Tomato Fest!
The farmers are busy picking tomatoes! Kids practice reading a pictograph to help Mr. Farmer figure out how many tomatoes he picked in this worksheet.
Third Grade
Data and Graphing
Worksheet
Pictographs: Say Cheese!
Worksheet
Pictographs: Say Cheese!
Third Grade
Data and Graphing
To keep track of his cheese sales, Giovanni uses a pictograph. Kids will figure out how his cheese business is doing by using data in the graph.
Worksheet
Pictographs: Say Cheese!
Worksheet
Pictographs: Say Cheese!
To keep track of his cheese sales, Giovanni uses a pictograph. Kids will figure out how his cheese business is doing by using data in the graph.
Third Grade
Data and Graphing
Worksheet
Comparing Pictographs: Taxi, Taxi
Worksheet
Comparing Pictographs: Taxi, Taxi
Third Grade
Addition
In this 3rd grade math worksheet, kids analyze and compare data in two pictographs in order to answer a set of word problems.
Worksheet
Comparing Pictographs: Taxi, Taxi
Worksheet
Comparing Pictographs: Taxi, Taxi
In this 3rd grade math worksheet, kids analyze and compare data in two pictographs in order to answer a set of word problems.
Third Grade
Addition
Worksheet
Reading a Bar Graph: Number of Athletes
Worksheet
Reading a Bar Graph: Number of Athletes
Third Grade
Data and Graphing
In this sports-themed worksheet, children use a bar graph to answer six questions about the number of athletes playing at a time in a variety of sporting events.
Worksheet
Reading a Bar Graph: Number of Athletes
Worksheet
Reading a Bar Graph: Number of Athletes
In this sports-themed worksheet, children use a bar graph to answer six questions about the number of athletes playing at a time in a variety of sporting events.
Third Grade
Data and Graphing
Worksheet
Bar Graph: Getting to School
Worksheet
Bar Graph: Getting to School
Third Grade
Data and Graphing
Kids completing this third grade math worksheet use a bar graph to compare data about transportation to school and solve addition and subtraction problems.
Worksheet
Bar Graph: Getting to School
Worksheet
Bar Graph: Getting to School
Kids completing this third grade math worksheet use a bar graph to compare data about transportation to school and solve addition and subtraction problems.
Third Grade
Data and Graphing
Worksheet
Picnic Bar Graph
Worksheet
Picnic Bar Graph
Second Grade
Data and Graphing
Which picnic games do you prefer? This bar graph shows some of the most popular picnic activities. Students will learn about analyzing data from a bar graph.
Worksheet
Picnic Bar Graph
Worksheet
Picnic Bar Graph
Which picnic games do you prefer? This bar graph shows some of the most popular picnic activities. Students will learn about analyzing data from a bar graph.
Second Grade
Data and Graphing
Worksheet
Comparing Pictographs: Football Time
Worksheet
Comparing Pictographs: Football Time
Third Grade
Data and Graphing
In this math worksheet, kids compare two pictographs that record the number of footballs kicked and the number of footballs thrown on the field.
Worksheet
Comparing Pictographs: Football Time
Worksheet
Comparing Pictographs: Football Time
In this math worksheet, kids compare two pictographs that record the number of footballs kicked and the number of footballs thrown on the field.
Third Grade
Data and Graphing
Worksheet
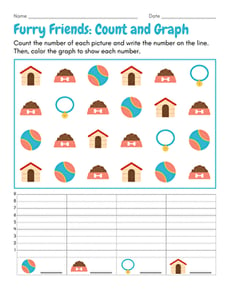
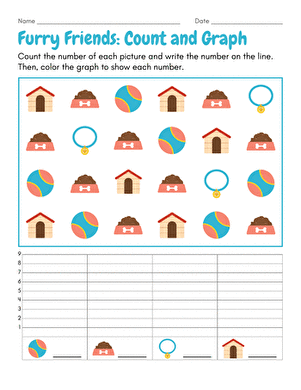
Furry Friends: Count and Graph
Worksheet
Furry Friends: Count and Graph
Kindergarten
Numbers and Counting
Practice early data analysis skills with this engaging counting and graphing worksheet!
Worksheet
Furry Friends: Count and Graph
Worksheet
Furry Friends: Count and Graph
Practice early data analysis skills with this engaging counting and graphing worksheet!
Kindergarten
Numbers and Counting
Worksheet
Reading Pictographs: Eggplant Cooking
Worksheet
Reading Pictographs: Eggplant Cooking
Third Grade
Data and Graphing
Mr. Chef keeps track of how many eggplants he uses with a pictograph. In this worksheet, kids use information in the pictograph to answer word problems.
Worksheet
Reading Pictographs: Eggplant Cooking
Worksheet
Reading Pictographs: Eggplant Cooking
Mr. Chef keeps track of how many eggplants he uses with a pictograph. In this worksheet, kids use information in the pictograph to answer word problems.
Third Grade
Data and Graphing
Worksheet
Histograms
Worksheet
Histograms
Sixth Grade
Data and Graphing
In this sixth-grade data and graphing worksheet, students will complete histograms from given data sets and frequency tables.
Worksheet
Histograms
Worksheet
Histograms
In this sixth-grade data and graphing worksheet, students will complete histograms from given data sets and frequency tables.
Sixth Grade
Data and Graphing
Worksheet
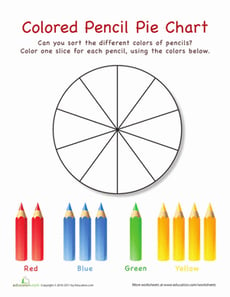
Pie Chart Practice: Colored Pencils
Worksheet
Pie Chart Practice: Colored Pencils
Second Grade
Data and Graphing
Your child might not be ready for statistics, but they can practice using pie charts with this fun, cute worksheet.
Worksheet
Pie Chart Practice: Colored Pencils
Worksheet
Pie Chart Practice: Colored Pencils
Your child might not be ready for statistics, but they can practice using pie charts with this fun, cute worksheet.
Second Grade
Data and Graphing
Worksheet
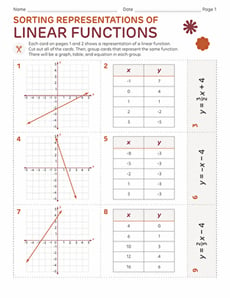
Sorting Representations of Linear Functions
Worksheet
Sorting Representations of Linear Functions
Eighth Grade
Algebra
Students make connections between different representations of functions with this hands-on card sorting activity!
Worksheet
Sorting Representations of Linear Functions
Worksheet
Sorting Representations of Linear Functions
Students make connections between different representations of functions with this hands-on card sorting activity!
Eighth Grade
Algebra
Worksheet
Create a Line Plot (With Your Own Data!)
Worksheet
Create a Line Plot (With Your Own Data!)
Second Grade
Data and Graphing
Invite students to become researchers with this open-ended line plot template!
Worksheet
Create a Line Plot (With Your Own Data!)
Worksheet
Create a Line Plot (With Your Own Data!)
Invite students to become researchers with this open-ended line plot template!
Second Grade
Data and Graphing
Worksheet
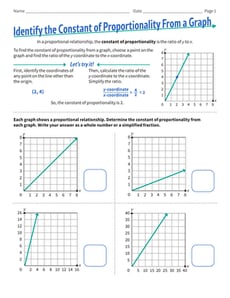
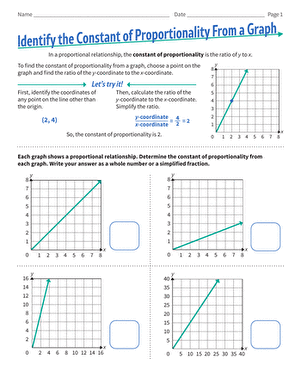
Identify the Constant of Proportionality From a Graph
Worksheet
Identify the Constant of Proportionality From a Graph
Seventh Grade
Ratios and Proportions
Give students plenty of practice identifying the constant of proportionality from a graph with this seventh- and eighth-grade math worksheet!
Worksheet
Identify the Constant of Proportionality From a Graph
Worksheet
Identify the Constant of Proportionality From a Graph
Give students plenty of practice identifying the constant of proportionality from a graph with this seventh- and eighth-grade math worksheet!
Seventh Grade
Ratios and Proportions
Worksheet
Slope Review
Worksheet
Slope Review
Eighth Grade
Algebra
Use this worksheet to help students review how to find the slope by calculating the rise over the run, or the change in y over the change in x.
Worksheet
Slope Review
Worksheet
Slope Review
Use this worksheet to help students review how to find the slope by calculating the rise over the run, or the change in y over the change in x.
Eighth Grade
Algebra
Worksheet
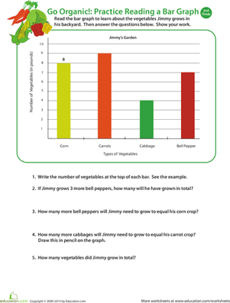
Go Organic! Practice Reading a Bar Graph
Worksheet
Go Organic! Practice Reading a Bar Graph
Second Grade
Data and Graphing
Boost your child's analytical thinking skills with this 2nd grade math worksheet in which he'll use data from a bar graph to answer word problems.
Worksheet
Go Organic! Practice Reading a Bar Graph
Worksheet
Go Organic! Practice Reading a Bar Graph
Boost your child's analytical thinking skills with this 2nd grade math worksheet in which he'll use data from a bar graph to answer word problems.
Second Grade
Data and Graphing
Worksheet
Making Comparative Inferences
Worksheet
Making Comparative Inferences
Seventh Grade
Data and Graphing
Give students practice creating box plots and making comparative inferences with this seventh-grade math worksheet!
Worksheet
Making Comparative Inferences
Worksheet
Making Comparative Inferences
Give students practice creating box plots and making comparative inferences with this seventh-grade math worksheet!
Seventh Grade
Data and Graphing
Worksheet
Graph Proportional Relationships #2
Worksheet
Graph Proportional Relationships #2
Eighth Grade
Ratios and Proportions
Students practice graphing proportional relationships based on relatable word problems in this eighth-grade math worksheet!
Worksheet
Graph Proportional Relationships #2
Worksheet
Graph Proportional Relationships #2
Students practice graphing proportional relationships based on relatable word problems in this eighth-grade math worksheet!
Eighth Grade
Ratios and Proportions
Worksheet
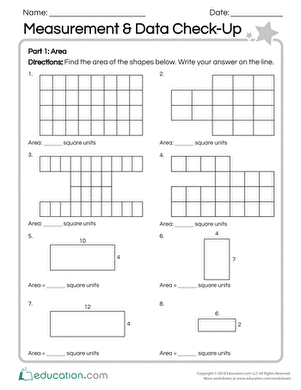
Measurement & Data Check-Up
Worksheet
Measurement & Data Check-Up
Third Grade
Geometry
Use this resource to assess your students’ mastery of concepts surrounding measurement and data.
Worksheet
Measurement & Data Check-Up
Worksheet
Measurement & Data Check-Up
Use this resource to assess your students’ mastery of concepts surrounding measurement and data.
Third Grade
Geometry
Worksheet
Creating Histograms From Frequency Tables
Worksheet
Creating Histograms From Frequency Tables
Sixth Grade
Data and Graphing
Practice using histograms to show different sets of data in this engaging sixth-grade worksheet!
Worksheet
Creating Histograms From Frequency Tables
Worksheet
Creating Histograms From Frequency Tables
Practice using histograms to show different sets of data in this engaging sixth-grade worksheet!
Sixth Grade
Data and Graphing
Worksheet
Math Table
Worksheet
Math Table
Second Grade
Data and Graphing
Help your second grader learn how to read a math table by using this math farm table to answer a set of questions.
Worksheet
Math Table
Worksheet
Math Table
Help your second grader learn how to read a math table by using this math farm table to answer a set of questions.
Second Grade
Data and Graphing
Worksheet
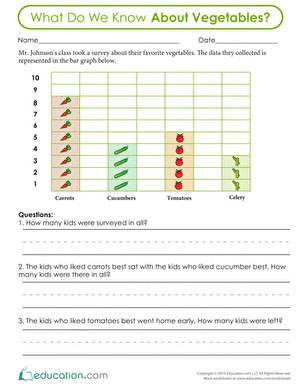
What Do We Know About Vegetables?
Worksheet
What Do We Know About Vegetables?
First Grade
Data and Graphing
This math worksheet asks students to problem solve using data. Students will satisfy their math appetite by counting, adding, and problem solving using the vegetable data in a bar graph.
Worksheet
What Do We Know About Vegetables?
Worksheet
What Do We Know About Vegetables?
This math worksheet asks students to problem solve using data. Students will satisfy their math appetite by counting, adding, and problem solving using the vegetable data in a bar graph.
First Grade
Data and Graphing
Worksheet
Pick a Flower Pictograph
Worksheet
Pick a Flower Pictograph
Second Grade
Data and Graphing
Find out exactly how many flowers Stefanie has planted with this pictograph for kids. Your child will learn how to analyze and interpret data.
Worksheet
Pick a Flower Pictograph
Worksheet
Pick a Flower Pictograph
Find out exactly how many flowers Stefanie has planted with this pictograph for kids. Your child will learn how to analyze and interpret data.
Second Grade
Data and Graphing
Worksheet
Insect Graphing
Lesson Plan
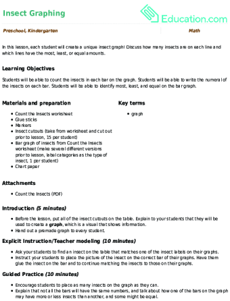
Insect Graphing
Pre-K
Numbers and Counting
In this lesson, each student will create a unique insect graph! Discuss how many insects are on each line and which lines have the most, least, or equal amounts.
Lesson Plan
Insect Graphing
Lesson Plan
Insect Graphing
In this lesson, each student will create a unique insect graph! Discuss how many insects are on each line and which lines have the most, least, or equal amounts.
Pre-K
Numbers and Counting
Lesson Plan
Second Grade Place Value
Workbook
Second Grade Place Value
Second Grade
Place Value
Second graders will develop a deeper understanding of place value in this engaging math workbook.
Workbook
Second Grade Place Value
Workbook
Second Grade Place Value
Second graders will develop a deeper understanding of place value in this engaging math workbook.
Second Grade
Place Value
Workbook
Time to the Minute: Analog Clocks #2
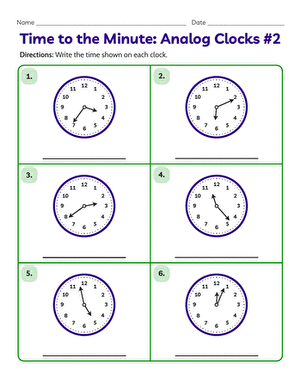
Worksheet
Time to the Minute: Analog Clocks #2
Third Grade
Time and Money
Give learners more practice telling time to the minute with this clock-reading worksheet!
Worksheet
Time to the Minute: Analog Clocks #2
Worksheet
Time to the Minute: Analog Clocks #2
Give learners more practice telling time to the minute with this clock-reading worksheet!
Third Grade
Time and Money
Worksheet
Learning Charts
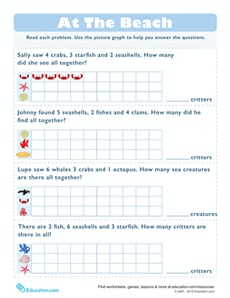
Worksheet
Learning Charts
First Grade
Data and Graphing
Take math practice to the beach with this intro to pictographs! Practice drawing each word problem on the chart.
Worksheet
Learning Charts
Worksheet
Learning Charts
Take math practice to the beach with this intro to pictographs! Practice drawing each word problem on the chart.
First Grade
Data and Graphing
Worksheet
1
2
3
4
5
6