SKIP TO CONTENT
Worksheet Generator
Subjects
Grades
Worksheets
Games
Build a Worksheet
More Resources
Roly Recommends
Summer Boost
Subjects
Grades
Worksheets
Games
Build a Worksheet
More Resources
Roly Recommends
Summer Boost
Showing Results for graphing data : Page 2
Filters
Math
533 results
Search for: graphing, data
✕
Math
✕
533 results
Subtopics:
Addition
Subtraction
Multiplication
Division
Numbers and Counting
Patterns
Place Value
Mixed Operations
Fractions
Decimals
Integers and Rational Numbers
Number Theory
Time and Money
Ratios and Proportions
Algebra
Geometry
Measurement
Data and Graphing
Probability
Statistics
Math Puzzles
Show Less
Filters
Search for: graphing, data
✕
Math
✕
Subjects
Math
English Language Arts
Science
Social Studies
Foreign Language
Grade Level
Pre-K
K
1st
2nd
3rd
4th
5th
6th
7th
8th
Early Childhood
Elementary School
Middle School
Resource Type
Worksheets
Games
Lesson Plans
Interactive Worksheets
Workbooks
Activities
Exercises
Songs
Offline Games
Guided Lessons
Teacher Resources
See more
Occasion
Birthdays
Spring
Easter
Summer
Back to School
Fall
Halloween
Winter
Holidays
Christmas
Hanukkah
Valentine's Day
See more
Common Core
Yes
Game Type
Mazes
Ball Games
Printable Board Games
Puzzles & Sudoku
English Language Support
Yes
See More
Clear All
View 533 results
Showing Results for graphing data : Page 2
Filters
533 results
Search for: graphing, data
✕
Math
✕
533 results
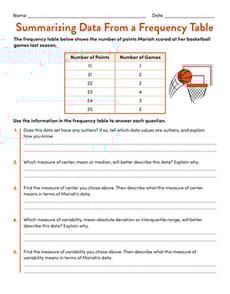
Summarizing Data From a Frequency Table
Worksheet
Summarizing Data From a Frequency Table
Sixth Grade
Data and Graphing
Practice summarizing a numerical data set with this one-page statistics worksheet!
Worksheet
Summarizing Data From a Frequency Table
Worksheet
Summarizing Data From a Frequency Table
Practice summarizing a numerical data set with this one-page statistics worksheet!
Sixth Grade
Data and Graphing
Worksheet
Data 1
Guided Lesson
Data 1
Third Grade
Fractions
Learning how to represent numerical information is a key part of the third grade math curriculum. This lesson in data provides guided instruction designed by our team of curriculum experts and teachers to present this concept in an engaging way. Not only that, but helpful exercises help kids to see the practical applicaton of these skills in the real world.
Guided Lesson
Data 1
Guided Lesson
Data 1
Learning how to represent numerical information is a key part of the third grade math curriculum. This lesson in data provides guided instruction designed by our team of curriculum experts and teachers to present this concept in an engaging way. Not only that, but helpful exercises help kids to see the practical applicaton of these skills in the real world.
Third Grade
Fractions
Guided Lesson
Collecting and Organizing Data 3
Exercise
Collecting and Organizing Data 3
Fifth Grade
Data and Graphing
By the time students complete this third exercise in the series, they will have become masters of collecting and organizing data.
Exercise
Collecting and Organizing Data 3
Exercise
Collecting and Organizing Data 3
By the time students complete this third exercise in the series, they will have become masters of collecting and organizing data.
Fifth Grade
Data and Graphing
Exercise
Measurement and Data 4
Guided Lesson
Measurement and Data 4
Fourth Grade
Fractions
Representing data on graphs makes math visual and involves some creativity and design. Plotting data using fractional units takes their learning one step further. Also in this unit, students learn to measure using both traditional units (like inches, feet and yards) and metric units, and how to convert measurements within each system. The concept of measurement gets two dimensional when students explore measuring and working with angles.
Guided Lesson
Measurement and Data 4
Guided Lesson
Measurement and Data 4
Representing data on graphs makes math visual and involves some creativity and design. Plotting data using fractional units takes their learning one step further. Also in this unit, students learn to measure using both traditional units (like inches, feet and yards) and metric units, and how to convert measurements within each system. The concept of measurement gets two dimensional when students explore measuring and working with angles.
Fourth Grade
Fractions
Guided Lesson
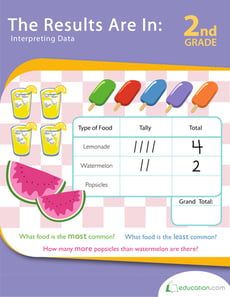
The Results Are In: Interpreting Data
Workbook
The Results Are In: Interpreting Data
Second Grade
Data and Graphing
Pictures and information go hand-in-hand in this workbook. Take a bite out of simple graphing and savor the math!
Workbook
The Results Are In: Interpreting Data
Workbook
The Results Are In: Interpreting Data
Pictures and information go hand-in-hand in this workbook. Take a bite out of simple graphing and savor the math!
Second Grade
Data and Graphing
Workbook
Summer Graphing
Worksheet
Summer Graphing
Kindergarten
Numbers and Counting
Shine some light on counting and graphing in this colorful summer worksheet!
Worksheet
Summer Graphing
Worksheet
Summer Graphing
Shine some light on counting and graphing in this colorful summer worksheet!
Kindergarten
Numbers and Counting
Worksheet
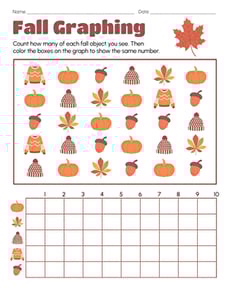
Fall Graphing
Worksheet
Fall Graphing
Kindergarten
Numbers and Counting
Get cozy with counting and graphing in this autumnal worksheet!
Worksheet
Fall Graphing
Worksheet
Fall Graphing
Get cozy with counting and graphing in this autumnal worksheet!
Kindergarten
Numbers and Counting
Worksheet
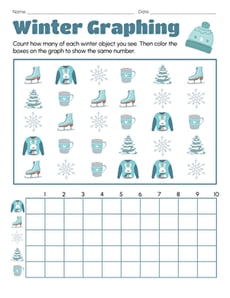
Winter Graphing
Worksheet
Winter Graphing
Kindergarten
Numbers and Counting
Warm up your counting and graphing skills in this cheerful winter worksheet!
Worksheet
Winter Graphing
Worksheet
Winter Graphing
Warm up your counting and graphing skills in this cheerful winter worksheet!
Kindergarten
Numbers and Counting
Worksheet
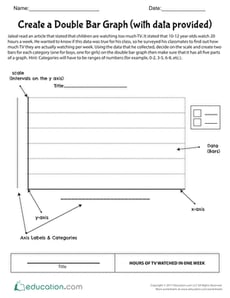
Create a Double Bar Graph (with data provided)
Worksheet
Create a Double Bar Graph (with data provided)
Fifth Grade
Data and Graphing
Ask your students to use data to create a double bar graph and interpret the graph with critical thinking.
Worksheet
Create a Double Bar Graph (with data provided)
Worksheet
Create a Double Bar Graph (with data provided)
Ask your students to use data to create a double bar graph and interpret the graph with critical thinking.
Fifth Grade
Data and Graphing
Worksheet
Glossary: Collect, Organize, and Discuss the Data
Worksheet
Glossary: Collect, Organize, and Discuss the Data
Third Grade
Fractions
Use this glossary with the EL Support Lesson: Collect, Organize, and Discuss the Data.
Worksheet
Glossary: Collect, Organize, and Discuss the Data
Worksheet
Glossary: Collect, Organize, and Discuss the Data
Use this glossary with the EL Support Lesson: Collect, Organize, and Discuss the Data.
Third Grade
Fractions
Worksheet
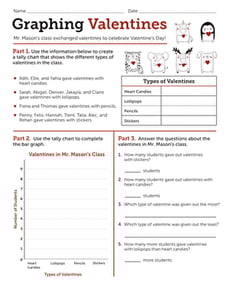
Graphing Valentines
Worksheet
Graphing Valentines
Second Grade
Data and Graphing
In this Valentine's Day math worksheet, learners will tally, graph, and interpret data about a classroom gift exchange.
Worksheet
Graphing Valentines
Worksheet
Graphing Valentines
In this Valentine's Day math worksheet, learners will tally, graph, and interpret data about a classroom gift exchange.
Second Grade
Data and Graphing
Worksheet
Create a Line Plot with Data Provided
Worksheet
Create a Line Plot with Data Provided
Third Grade
Data and Graphing
Use the data provided to have your students create a line plot that reflects how much TV watched per week for one third grade class.
Worksheet
Create a Line Plot with Data Provided
Worksheet
Create a Line Plot with Data Provided
Use the data provided to have your students create a line plot that reflects how much TV watched per week for one third grade class.
Third Grade
Data and Graphing
Worksheet
Find the Missing Data Using the Mean #1
Worksheet
Find the Missing Data Using the Mean #1
Sixth Grade
Statistics
Reveal missing data using the mean with this engaging math worksheet!
Worksheet
Find the Missing Data Using the Mean #1
Worksheet
Find the Missing Data Using the Mean #1
Reveal missing data using the mean with this engaging math worksheet!
Sixth Grade
Statistics
Worksheet
Creating a Bar Graph: Favorite Picnic Spots
Worksheet
Creating a Bar Graph: Favorite Picnic Spots
Second Grade
Data and Graphing
Learners practice charting and graphing data in this hands-on worksheet.
Worksheet
Creating a Bar Graph: Favorite Picnic Spots
Worksheet
Creating a Bar Graph: Favorite Picnic Spots
Learners practice charting and graphing data in this hands-on worksheet.
Second Grade
Data and Graphing
Worksheet
Garden Graphing
Worksheet
Garden Graphing
First Grade
Data and Graphing
Kids boost counting and graphing skills as they make a graph to illustrate the rabbit's garden vegetable pickings.
Worksheet
Garden Graphing
Worksheet
Garden Graphing
Kids boost counting and graphing skills as they make a graph to illustrate the rabbit's garden vegetable pickings.
First Grade
Data and Graphing
Worksheet
Vocabulary Cards: Collect, Organize, and Discuss the Data
Worksheet
Vocabulary Cards: Collect, Organize, and Discuss the Data
Third Grade
Fractions
Use these vocabulary cards with the EL Support Lesson: Collect, Organize, and Discuss the Data.
Worksheet
Vocabulary Cards: Collect, Organize, and Discuss the Data
Worksheet
Vocabulary Cards: Collect, Organize, and Discuss the Data
Use these vocabulary cards with the EL Support Lesson: Collect, Organize, and Discuss the Data.
Third Grade
Fractions
Worksheet
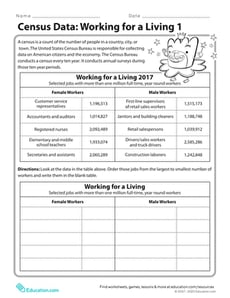
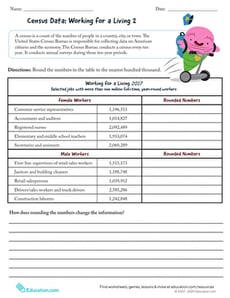
Census Data: Working for a Living 1
Worksheet
Census Data: Working for a Living 1
Fourth Grade
Math
Use the worksheet Census Data 2017: Working for a Living 1 to help learners order numbers from real-life data up to the millions place. Ask learners to compare and order the job and its total number of workers in the blank table from greatest to least.
Worksheet
Census Data: Working for a Living 1
Worksheet
Census Data: Working for a Living 1
Use the worksheet Census Data 2017: Working for a Living 1 to help learners order numbers from real-life data up to the millions place. Ask learners to compare and order the job and its total number of workers in the blank table from greatest to least.
Fourth Grade
Math
Worksheet
Data Chart: The Dodge City Train Station
Worksheet
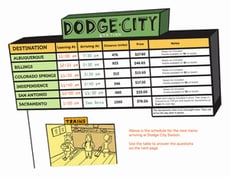
Data Chart: The Dodge City Train Station
Fourth Grade
Measurement
Give your fourth-grader some real-world chart-reading practice with a familiar data chart: a train schedule!
Worksheet
Data Chart: The Dodge City Train Station
Worksheet
Data Chart: The Dodge City Train Station
Give your fourth-grader some real-world chart-reading practice with a familiar data chart: a train schedule!
Fourth Grade
Measurement
Worksheet
Practice Finding Range
Worksheet
Practice Finding Range
Sixth Grade
Data and Graphing
Give your students practice finding the range of a data set with this sixth-grade data and graphing worksheet!
Worksheet
Practice Finding Range
Worksheet
Practice Finding Range
Give your students practice finding the range of a data set with this sixth-grade data and graphing worksheet!
Sixth Grade
Data and Graphing
Worksheet
Doing Data: The Pet Store Tally
Worksheet
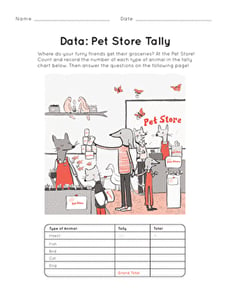
Doing Data: The Pet Store Tally
First Grade
Data and Graphing
Not only is this filled with cute animal images, but it gives your first grader just the practice they need to get comfortable tallying up sets of data.
Worksheet
Doing Data: The Pet Store Tally
Worksheet
Doing Data: The Pet Store Tally
Not only is this filled with cute animal images, but it gives your first grader just the practice they need to get comfortable tallying up sets of data.
First Grade
Data and Graphing
Worksheet
Histograms
Worksheet
Histograms
Sixth Grade
Data and Graphing
In this sixth-grade data and graphing worksheet, students will complete histograms from given data sets and frequency tables.
Worksheet
Histograms
Worksheet
Histograms
In this sixth-grade data and graphing worksheet, students will complete histograms from given data sets and frequency tables.
Sixth Grade
Data and Graphing
Worksheet
Bar Graphing with Eggs
Game
Bar Graphing with Eggs
Third Grade
Data and Graphing
It's raining eggs! Kids must move quickly to catch eggs for Farmer Brown, organizing and displaying the data using bar graphs in this silly game.
Game
Bar Graphing with Eggs
Game
Bar Graphing with Eggs
It's raining eggs! Kids must move quickly to catch eggs for Farmer Brown, organizing and displaying the data using bar graphs in this silly game.
Third Grade
Data and Graphing
Game
Using Data
Worksheet
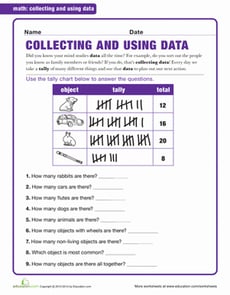
Using Data
First Grade
Data and Graphing
This worksheet provides excellent practice adding, interpreting, and organizing information.
Worksheet
Using Data
Worksheet
Using Data
This worksheet provides excellent practice adding, interpreting, and organizing information.
First Grade
Data and Graphing
Worksheet
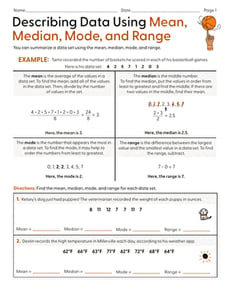
Describing Data Using Mean, Median, Mode, and Range
Worksheet
Describing Data Using Mean, Median, Mode, and Range
Sixth Grade
Statistics
Students describe data using measures of center and a measure of variability in this statistics worksheet for middle grades!
Worksheet
Describing Data Using Mean, Median, Mode, and Range
Worksheet
Describing Data Using Mean, Median, Mode, and Range
Students describe data using measures of center and a measure of variability in this statistics worksheet for middle grades!
Sixth Grade
Statistics
Worksheet
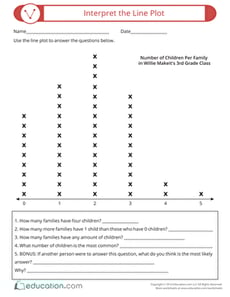
Interpret the Line Plot
Worksheet
Interpret the Line Plot
Second Grade
Data and Graphing
Students will get important practice analyzing line plots in this graphing and data worksheet.
Worksheet
Interpret the Line Plot
Worksheet
Interpret the Line Plot
Students will get important practice analyzing line plots in this graphing and data worksheet.
Second Grade
Data and Graphing
Worksheet
Ice Cream Bar Graph #3
Worksheet
Ice Cream Bar Graph #3
First Grade
Data and Graphing
Practice graphing data with Sam, Kate and Becky as they sell ice cream cones! Keep track of their sales by putting the data into a bar graph.
Worksheet
Ice Cream Bar Graph #3
Worksheet
Ice Cream Bar Graph #3
Practice graphing data with Sam, Kate and Becky as they sell ice cream cones! Keep track of their sales by putting the data into a bar graph.
First Grade
Data and Graphing
Worksheet
Census Data: Working for a Living 2
Worksheet
Census Data: Working for a Living 2
Fourth Grade
Place Value
Use the worksheet Census Data 2017: Working for a Living 2 to help learners round the total number of workers to the nearest hundred millions place.
Worksheet
Census Data: Working for a Living 2
Worksheet
Census Data: Working for a Living 2
Use the worksheet Census Data 2017: Working for a Living 2 to help learners round the total number of workers to the nearest hundred millions place.
Fourth Grade
Place Value
Worksheet
Beginning Bar Graphs: Favorite Sports
Worksheet
Beginning Bar Graphs: Favorite Sports
First Grade
Data and Graphing
This worksheet is a fun, hands on way to practice beginning data and graphing skills.
Worksheet
Beginning Bar Graphs: Favorite Sports
Worksheet
Beginning Bar Graphs: Favorite Sports
This worksheet is a fun, hands on way to practice beginning data and graphing skills.
First Grade
Data and Graphing
Worksheet
Ice Cream Graph #18
Worksheet
Ice Cream Graph #18
First Grade
Data and Graphing
Practice graphing data with Sam, Kate and Becky as they sell ice cream cones! Your child will keep track of their sales by drawing the data into a pictograph.
Worksheet
Ice Cream Graph #18
Worksheet
Ice Cream Graph #18
Practice graphing data with Sam, Kate and Becky as they sell ice cream cones! Your child will keep track of their sales by drawing the data into a pictograph.
First Grade
Data and Graphing
Worksheet
Ice Cream Graph #13
Worksheet
Ice Cream Graph #13
First Grade
Data and Graphing
Practice graphing data with Sam, Kate and Becky as they sell ice cream cones! Your child will keep track of their sales by putting the data into a pictograph.
Worksheet
Ice Cream Graph #13
Worksheet
Ice Cream Graph #13
Practice graphing data with Sam, Kate and Becky as they sell ice cream cones! Your child will keep track of their sales by putting the data into a pictograph.
First Grade
Data and Graphing
Worksheet
1
2
3
4
…
18