SKIP TO CONTENT
Worksheet Generator
Subjects
Grades
Worksheets
Games
Build a Worksheet
More Resources
Roly Recommends
Subjects
Grades
Worksheets
Games
Build a Worksheet
More Resources
Roly Recommends
All Subjects
Math
Data and Graphing
Subtopics:
Collecting and Organizing Data
Picture Graphs
Bar Graphs
Coordinate Plane
Histograms
Show Less
Filters
Search for: complete, sentences, vs, fragments
✕
Math
✕
Subjects
Math
English Language Arts
Science
Social Studies
Foreign Language
Grade Level
Pre-K
K
1st
2nd
3rd
4th
5th
6th
7th
8th
Early Childhood
Elementary School
Middle School
Resource Type
Worksheets
Games
Lesson Plans
Interactive Worksheets
Workbooks
Activities
Exercises
Guided Lessons
Occasion
Birthdays
Earth Day
Summer
Back to School
Holidays
Common Core
Yes
Arts & Crafts
Arts & Crafts
Paper & Glue Crafts
Construction & Sculpture
English Language Support
Yes
See More
Clear All
View 63 results
Showing Results for complete sentences vs fragments : Page 2
63 results
Search for: complete, sentences, vs, fragments
✕
Math
✕
Sort by:
Relevance
Most recent
Most popular
Alphabetical A-Z
Alphabetical Z-A
All filters
63 results
Sort by:
Relevance
Most recent
Most popular
Alphabetical A-Z
Alphabetical Z-A
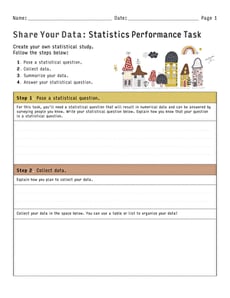
Share Your Data: Statistics Performance Task
Worksheet
Share Your Data: Statistics Performance Task
Sixth Grade
Data and Graphing
Create your own statistical study with this open-ended math worksheet for sixth graders!
Worksheet
Share Your Data: Statistics Performance Task
Worksheet
Share Your Data: Statistics Performance Task
Create your own statistical study with this open-ended math worksheet for sixth graders!
Sixth Grade
Data and Graphing
Worksheet
Picture Graphing with Fish
Game
Picture Graphing with Fish
Third Grade
Data and Graphing
Fish, fish everywhere! Kids catch fish to sort and graph in this zany game.
Game
Picture Graphing with Fish
Game
Picture Graphing with Fish
Fish, fish everywhere! Kids catch fish to sort and graph in this zany game.
Third Grade
Data and Graphing
Game
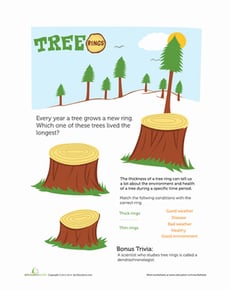
Count the Tree Rings
Worksheet
Count the Tree Rings
Kindergarten
Numbers and Counting
This printable will help your child with their observation skills by challenging them to count the tree rings to determine their ages.
Worksheet
Count the Tree Rings
Worksheet
Count the Tree Rings
This printable will help your child with their observation skills by challenging them to count the tree rings to determine their ages.
Kindergarten
Numbers and Counting
Worksheet
Circle What Belongs: Rainy Day
Worksheet
Circle What Belongs: Rainy Day
Pre-K
Data and Graphing
Which shoes are better for a rainy day, sandals or boots? This worksheet helps kids think critically about what things they see when the rain is pouring.
Worksheet
Circle What Belongs: Rainy Day
Worksheet
Circle What Belongs: Rainy Day
Which shoes are better for a rainy day, sandals or boots? This worksheet helps kids think critically about what things they see when the rain is pouring.
Pre-K
Data and Graphing
Worksheet
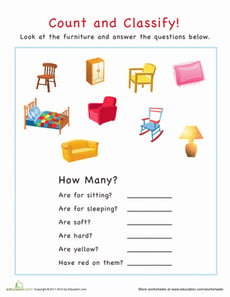
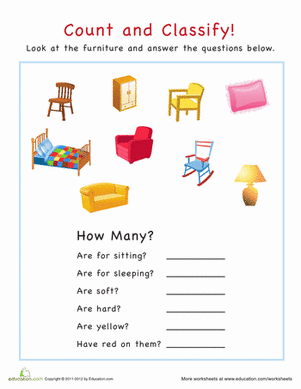
Count and Classify: Furniture
Worksheet
Count and Classify: Furniture
Pre-K
Numbers and Counting
Your child will use his powers of deduction to count and classify the furniture in this worksheet. Count and classify the furniture pictured with your child.
Worksheet
Count and Classify: Furniture
Worksheet
Count and Classify: Furniture
Your child will use his powers of deduction to count and classify the furniture in this worksheet. Count and classify the furniture pictured with your child.
Pre-K
Numbers and Counting
Worksheet
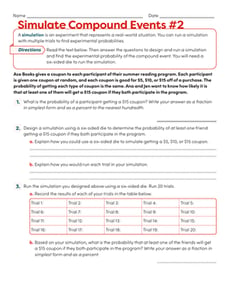
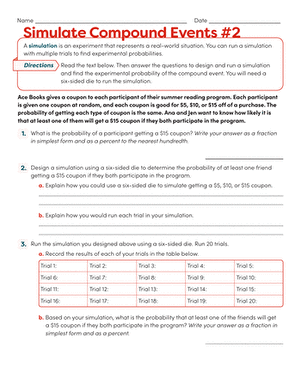
Simulate Compound Events #2
Worksheet
Simulate Compound Events #2
Seventh Grade
Data and Graphing
Give students additional practice designing and running a simulation to determine the probability of real-world compound events!
Worksheet
Simulate Compound Events #2
Worksheet
Simulate Compound Events #2
Give students additional practice designing and running a simulation to determine the probability of real-world compound events!
Seventh Grade
Data and Graphing
Worksheet
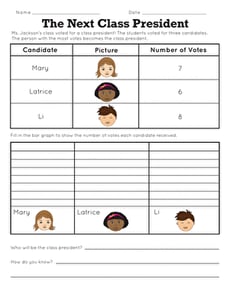
The Next Class President
Worksheet
The Next Class President
Second Grade
Numbers and Counting
In this beginning data and graphing worksheet, kindergartners and first graders get an introduction to the process of voting and outcomes.
Worksheet
The Next Class President
Worksheet
The Next Class President
In this beginning data and graphing worksheet, kindergartners and first graders get an introduction to the process of voting and outcomes.
Second Grade
Numbers and Counting
Worksheet
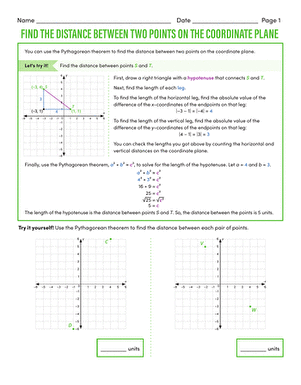
Find the Distance Between Two Points on the Coordinate Plane
Interactive Worksheet
Find the Distance Between Two Points on the Coordinate Plane
Eighth Grade
Geometry
Did you know that you can use the Pythagorean theorem to find the distance between two points on the coordinate plane? Try it out with this eighth-grade geometry worksheet!
Interactive Worksheet
Find the Distance Between Two Points on the Coordinate Plane
Interactive Worksheet
Find the Distance Between Two Points on the Coordinate Plane
Did you know that you can use the Pythagorean theorem to find the distance between two points on the coordinate plane? Try it out with this eighth-grade geometry worksheet!
Eighth Grade
Geometry
Interactive Worksheet
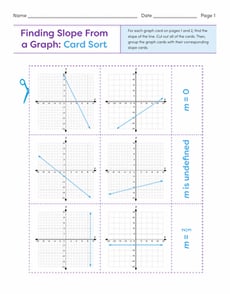
Finding Slope From a Graph: Card Sort
Worksheet
Finding Slope From a Graph: Card Sort
Eighth Grade
Algebra
Use this hands-on card sort activity to give students practice determining slope from a graph!
Worksheet
Finding Slope From a Graph: Card Sort
Worksheet
Finding Slope From a Graph: Card Sort
Use this hands-on card sort activity to give students practice determining slope from a graph!
Eighth Grade
Algebra
Worksheet
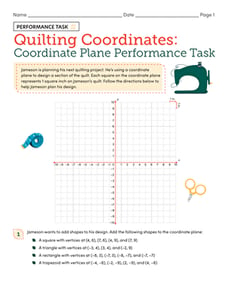
Quilting Coordinates: Coordinate Plane Performance Task
Worksheet
Quilting Coordinates: Coordinate Plane Performance Task
Sixth Grade
Geometry
Help Jameson plan his design for a quilting project in this coordinate plane performance task!
Worksheet
Quilting Coordinates: Coordinate Plane Performance Task
Worksheet
Quilting Coordinates: Coordinate Plane Performance Task
Help Jameson plan his design for a quilting project in this coordinate plane performance task!
Sixth Grade
Geometry
Worksheet
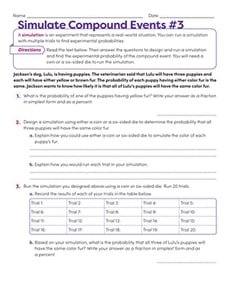
Simulate Compound Events #3
Worksheet
Simulate Compound Events #3
Seventh Grade
Data and Graphing
Give students more practice designing and running a simulation to determine the probability of real-world compound events!
Worksheet
Simulate Compound Events #3
Worksheet
Simulate Compound Events #3
Give students more practice designing and running a simulation to determine the probability of real-world compound events!
Seventh Grade
Data and Graphing
Worksheet
Describing Distributions in Histograms
Worksheet
Describing Distributions in Histograms
Sixth Grade
Data and Graphing
Help students deepen their understanding of histograms with this this two-page data and graphing worksheet!
Worksheet
Describing Distributions in Histograms
Worksheet
Describing Distributions in Histograms
Help students deepen their understanding of histograms with this this two-page data and graphing worksheet!
Sixth Grade
Data and Graphing
Worksheet
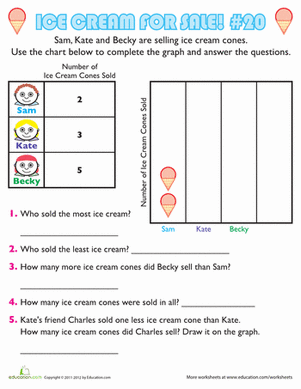
Ice Cream Graph #20
Worksheet
Ice Cream Graph #20
First Grade
Data and Graphing
Young entrepreneurs Sam, Kate, and Becky sold some ice cream cones, but they need help figuring out how many. Exercise pictograph skills in this worksheet.
Worksheet
Ice Cream Graph #20
Worksheet
Ice Cream Graph #20
Young entrepreneurs Sam, Kate, and Becky sold some ice cream cones, but they need help figuring out how many. Exercise pictograph skills in this worksheet.
First Grade
Data and Graphing
Worksheet
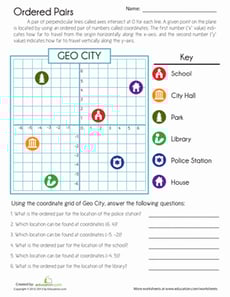
Coordinate Grid Map
Worksheet
Coordinate Grid Map
Fourth Grade
Geometry
Navigate this map of Geo City! Put those graphing skills to the test by identifying and locating ordered pairs on this coordinate grid map.
Worksheet
Coordinate Grid Map
Worksheet
Coordinate Grid Map
Navigate this map of Geo City! Put those graphing skills to the test by identifying and locating ordered pairs on this coordinate grid map.
Fourth Grade
Geometry
Worksheet
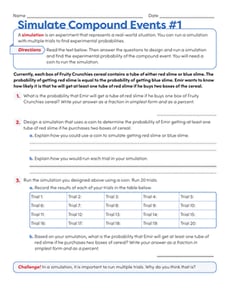
Simulate Compound Events #1
Worksheet
Simulate Compound Events #1
Seventh Grade
Data and Graphing
Practice designing a simulation for real-world compound events with this seventh-grade probability worksheet!
Worksheet
Simulate Compound Events #1
Worksheet
Simulate Compound Events #1
Practice designing a simulation for real-world compound events with this seventh-grade probability worksheet!
Seventh Grade
Data and Graphing
Worksheet
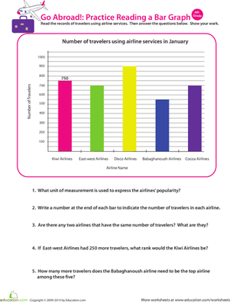
Going Abroad: Practice Reading a Bar Graph
Worksheet
Going Abroad: Practice Reading a Bar Graph
Fourth Grade
Data and Graphing
This 4th grade math worksheet will challenge your child's analytical thinking skills. He'll read a bar graph, then use its data to answer a set of questions.
Worksheet
Going Abroad: Practice Reading a Bar Graph
Worksheet
Going Abroad: Practice Reading a Bar Graph
This 4th grade math worksheet will challenge your child's analytical thinking skills. He'll read a bar graph, then use its data to answer a set of questions.
Fourth Grade
Data and Graphing
Worksheet
Snow Fun
Worksheet
Snow Fun
First Grade
Numbers and Counting
Searching for a worksheet that will give your kid help with common math concepts? This counting worksheet is full of snow fun!
Worksheet
Snow Fun
Worksheet
Snow Fun
Searching for a worksheet that will give your kid help with common math concepts? This counting worksheet is full of snow fun!
First Grade
Numbers and Counting
Worksheet
Bar Graphs: Interpreting Data
Lesson Plan
Bar Graphs: Interpreting Data
Second Grade
Data and Graphing
In this lesson, students will make bar graphs and interpret data using real-life data from other students. They will get practice writing and answering survey questions.
Lesson Plan
Bar Graphs: Interpreting Data
Lesson Plan
Bar Graphs: Interpreting Data
In this lesson, students will make bar graphs and interpret data using real-life data from other students. They will get practice writing and answering survey questions.
Second Grade
Data and Graphing
Lesson Plan
Constructing Two-Way Relative Frequency Tables
Interactive Worksheet
Constructing Two-Way Relative Frequency Tables
Eighth Grade
Data and Graphing
Practice creating two-way relative frequency tables based on real-world scenarios with this eighth-grade math worksheet!
Interactive Worksheet
Constructing Two-Way Relative Frequency Tables
Interactive Worksheet
Constructing Two-Way Relative Frequency Tables
Practice creating two-way relative frequency tables based on real-world scenarios with this eighth-grade math worksheet!
Eighth Grade
Data and Graphing
Interactive Worksheet
Probability Dice: Practice With Probability Models
Worksheet
Probability Dice: Practice With Probability Models
Seventh Grade
Data and Graphing
Probability can be as easy as rolling dice! What is the probability of rolling a 2? What about a 6? Practice calculating basic probability with this worksheet.
Worksheet
Probability Dice: Practice With Probability Models
Worksheet
Probability Dice: Practice With Probability Models
Probability can be as easy as rolling dice! What is the probability of rolling a 2? What about a 6? Practice calculating basic probability with this worksheet.
Seventh Grade
Data and Graphing
Worksheet
Olympic Math: Mean, Median and Mode Review
Lesson Plan
Olympic Math: Mean, Median and Mode Review
Fifth Grade
Data and Graphing
Help your students win gold with this lesson that gives them plenty of practice with mode, median, and mean.
Lesson Plan
Olympic Math: Mean, Median and Mode Review
Lesson Plan
Olympic Math: Mean, Median and Mode Review
Help your students win gold with this lesson that gives them plenty of practice with mode, median, and mean.
Fifth Grade
Data and Graphing
Lesson Plan
Make an Edible Fruitloop Bracelet
Activity
Make an Edible Fruitloop Bracelet
Kindergarten
Data and Graphing
Make an edible bracelet from Froot Loops and a shoelace! This Block Institute art activity will engage your special needs or mainstream child at snacktime.
Activity
Make an Edible Fruitloop Bracelet
Activity
Make an Edible Fruitloop Bracelet
Make an edible bracelet from Froot Loops and a shoelace! This Block Institute art activity will engage your special needs or mainstream child at snacktime.
Kindergarten
Data and Graphing
Activity
Mighty Mean, Median, and Mode
Lesson Plan
Mighty Mean, Median, and Mode
Fourth Grade
Data and Graphing
Give your students a good basis in interpreting data with this lesson that teaches them about mean, median, and mode with plenty of practice and cute videos to keep them interested.
Lesson Plan
Mighty Mean, Median, and Mode
Lesson Plan
Mighty Mean, Median, and Mode
Give your students a good basis in interpreting data with this lesson that teaches them about mean, median, and mode with plenty of practice and cute videos to keep them interested.
Fourth Grade
Data and Graphing
Lesson Plan
Mean, Median and Mode Madness!
Lesson Plan
Mean, Median and Mode Madness!
Third Grade
Data and Graphing
This lesson introduces students to the concepts of mean, median, and mode in a hands-on and visual way.
Lesson Plan
Mean, Median and Mode Madness!
Lesson Plan
Mean, Median and Mode Madness!
This lesson introduces students to the concepts of mean, median, and mode in a hands-on and visual way.
Third Grade
Data and Graphing
Lesson Plan
Graphing Colored Counters
Lesson Plan
Graphing Colored Counters
Kindergarten
Data and Graphing
In this lesson, your students will use the background knowledge that they have about counting and sorting to graph data. They will practice answering questions about the graph!
Lesson Plan
Graphing Colored Counters
Lesson Plan
Graphing Colored Counters
In this lesson, your students will use the background knowledge that they have about counting and sorting to graph data. They will practice answering questions about the graph!
Kindergarten
Data and Graphing
Lesson Plan
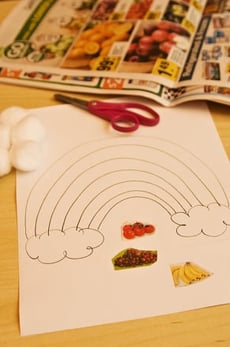
Create a Rainbow of Healthy Food
Activity
Create a Rainbow of Healthy Food
Pre-K
Data and Graphing
Help your preschooler chart her good eating habits with this arts and crafts activity that has her making a healthy fruits and vegetables rainbow and graph!
Activity
Create a Rainbow of Healthy Food
Activity
Create a Rainbow of Healthy Food
Help your preschooler chart her good eating habits with this arts and crafts activity that has her making a healthy fruits and vegetables rainbow and graph!
Pre-K
Data and Graphing
Activity
Let's Graph Our Fall Favorites!
Lesson Plan
Let's Graph Our Fall Favorites!
Second Grade
Data and Graphing
This engaging math lesson combines all of your kid's fall favorites as they learn to represent data using a bar graph.
Lesson Plan
Let's Graph Our Fall Favorites!
Lesson Plan
Let's Graph Our Fall Favorites!
This engaging math lesson combines all of your kid's fall favorites as they learn to represent data using a bar graph.
Second Grade
Data and Graphing
Lesson Plan
Track the Weather with Weather Charts
Activity
Track the Weather with Weather Charts
Third Grade
Measurement
Learn about the microclimate of your backyard by tracking rainfall, temperature, and observed weather with hand drawn charts and graphs.
Activity
Track the Weather with Weather Charts
Activity
Track the Weather with Weather Charts
Learn about the microclimate of your backyard by tracking rainfall, temperature, and observed weather with hand drawn charts and graphs.
Third Grade
Measurement
Activity
Create a Color Collage
Activity
Create a Color Collage
Pre-K
Data and Graphing
Here's a preschool color collage activity to help your child work on their sorting skills, and create a beautiful addition to the refrigerator gallery.
Activity
Create a Color Collage
Activity
Create a Color Collage
Here's a preschool color collage activity to help your child work on their sorting skills, and create a beautiful addition to the refrigerator gallery.
Pre-K
Data and Graphing
Activity
Draw a Birthday Bar Graph
Activity
Draw a Birthday Bar Graph
Third Grade
Data and Graphing
Liven up a lesson about graphing by helping your third grader compile a bar graph from his classmates' birthday data.
Activity
Draw a Birthday Bar Graph
Activity
Draw a Birthday Bar Graph
Liven up a lesson about graphing by helping your third grader compile a bar graph from his classmates' birthday data.
Third Grade
Data and Graphing
Activity
1
2
3