SKIP TO CONTENT
Worksheet Generator
Subjects
Grades
Worksheets
Games
Build a Worksheet
More Resources
Roly Recommends
Summer Boost
Subjects
Grades
Worksheets
Games
Build a Worksheet
More Resources
Roly Recommends
Summer Boost
Showing Results for data
Filters
Math
13 results
Search for: data
✕
Math
✕
Lesson Plans
✕
1st - 4th Grade
✕
Clear all
13 results
Subtopics:
Multiplication
Time and Money
Geometry
Measurement
Data and Graphing
Probability
Statistics
Show Less
Filters
Search for: data
✕
Math
✕
Lesson Plans
✕
1st - 4th Grade
✕
Subjects
Math
English Language Arts
Grade Level
Pre-K
K
1st
2nd
3rd
4th
5th
6th
7th
8th
Early Childhood
Elementary School
Middle School
Resource Type
Worksheets
Games
Lesson Plans
Interactive Worksheets
Workbooks
Activities
Exercises
Songs
Offline Games
Guided Lessons
Teacher Resources
Common Core
Yes
English Language Support
Yes
Clear all
View 13 results
Showing Results for data
Filters
13 results
Search for: data
✕
Math
✕
Lesson Plans
✕
1st - 4th Grade
✕
Clear all
13 results
Let’s Talk About Data!
Lesson Plan
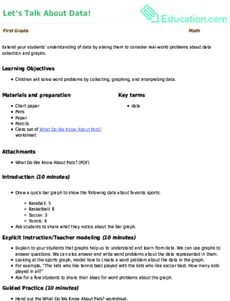
Let’s Talk About Data!
First Grade
Math
Extend your students' understanding of data by asking them to consider real-world problems about data collection and graphs.
Lesson Plan
Let’s Talk About Data!
Lesson Plan
Let’s Talk About Data!
Extend your students' understanding of data by asking them to consider real-world problems about data collection and graphs.
First Grade
Math
Lesson Plan
Bar Graphs: Interpreting Data
Lesson Plan
Bar Graphs: Interpreting Data
Second Grade
Data and Graphing
In this lesson, students will make bar graphs and interpret data using real-life data from other students. They will get practice writing and answering survey questions.
Lesson Plan
Bar Graphs: Interpreting Data
Lesson Plan
Bar Graphs: Interpreting Data
In this lesson, students will make bar graphs and interpret data using real-life data from other students. They will get practice writing and answering survey questions.
Second Grade
Data and Graphing
Lesson Plan
Let's Play Ball
Lesson Plan
Let's Play Ball
Third Grade
Multiplication
Students will have a ball with this data collection lesson plan where they learn about collecting and plotting data on a chart and line plot.
Lesson Plan
Let's Play Ball
Lesson Plan
Let's Play Ball
Students will have a ball with this data collection lesson plan where they learn about collecting and plotting data on a chart and line plot.
Third Grade
Multiplication
Lesson Plan
Let's Graph Our Fall Favorites!
Lesson Plan
Let's Graph Our Fall Favorites!
Second Grade
Data and Graphing
This engaging math lesson combines all of your kid's fall favorites as they learn to represent data using a bar graph.
Lesson Plan
Let's Graph Our Fall Favorites!
Lesson Plan
Let's Graph Our Fall Favorites!
This engaging math lesson combines all of your kid's fall favorites as they learn to represent data using a bar graph.
Second Grade
Data and Graphing
Lesson Plan
What is it Telling Me? Creating and Interpreting Line Plots
Lesson Plan
What is it Telling Me? Creating and Interpreting Line Plots
Third Grade
Data and Graphing
Line plots are a great way to introduce your students to graphing data. In this lesson, your students will learn how to create a line plot and also practice interpreting line plots.
Lesson Plan
What is it Telling Me? Creating and Interpreting Line Plots
Lesson Plan
What is it Telling Me? Creating and Interpreting Line Plots
Line plots are a great way to introduce your students to graphing data. In this lesson, your students will learn how to create a line plot and also practice interpreting line plots.
Third Grade
Data and Graphing
Lesson Plan
Graphing Colored Counters
Lesson Plan
Graphing Colored Counters
Kindergarten
Data and Graphing
In this lesson, your students will use the background knowledge that they have about counting and sorting to graph data. They will practice answering questions about the graph!
Lesson Plan
Graphing Colored Counters
Lesson Plan
Graphing Colored Counters
In this lesson, your students will use the background knowledge that they have about counting and sorting to graph data. They will practice answering questions about the graph!
Kindergarten
Data and Graphing
Lesson Plan
Line Plots: Representing the Length of Classroom Items
Lesson Plan
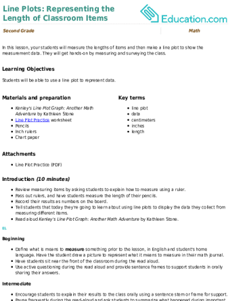
Line Plots: Representing the Length of Classroom Items
Second Grade
Measurement
In this lesson, your students will measure the lengths of items and then make a line plot to show the measurement data. They will get hands-on by measuring and surveying the class.
Lesson Plan
Line Plots: Representing the Length of Classroom Items
Lesson Plan
Line Plots: Representing the Length of Classroom Items
In this lesson, your students will measure the lengths of items and then make a line plot to show the measurement data. They will get hands-on by measuring and surveying the class.
Second Grade
Measurement
Lesson Plan
Mighty Mean, Median, and Mode
Lesson Plan
Mighty Mean, Median, and Mode
Fourth Grade
Data and Graphing
Give your students a good basis in interpreting data with this lesson that teaches them about mean, median, and mode with plenty of practice and cute videos to keep them interested.
Lesson Plan
Mighty Mean, Median, and Mode
Lesson Plan
Mighty Mean, Median, and Mode
Give your students a good basis in interpreting data with this lesson that teaches them about mean, median, and mode with plenty of practice and cute videos to keep them interested.
Fourth Grade
Data and Graphing
Lesson Plan
EL
Graph My Design
Lesson Plan
Graph My Design
First Grade
Geometry
Geometry meets data in this fun lesson! Students will build a design using pattern blocks and then graph the number of each shape used. This scaffolded EL lesson can be used alone or alongside
Graphing Colored Counters.
Lesson Plan
EL
Graph My Design
Lesson Plan
Graph My Design
Geometry meets data in this fun lesson! Students will build a design using pattern blocks and then graph the number of each shape used. This scaffolded EL lesson can be used alone or alongside
Graphing Colored Counters.
First Grade
Geometry
Lesson Plan
Math + Love = Valentine's Day Bar Graph
Lesson Plan
Math + Love = Valentine's Day Bar Graph
Second Grade
Data and Graphing
What's more romantic than a bar graph on Valentine's Day? In this Valentine's Day lesson plan, students will use information from a data set to create their own tally charts and bar graphs and then analyze these graphs to answer questions.
Lesson Plan
Math + Love = Valentine's Day Bar Graph
Lesson Plan
Math + Love = Valentine's Day Bar Graph
What's more romantic than a bar graph on Valentine's Day? In this Valentine's Day lesson plan, students will use information from a data set to create their own tally charts and bar graphs and then analyze these graphs to answer questions.
Second Grade
Data and Graphing
Lesson Plan
Tour the World: Climates
Lesson Plan
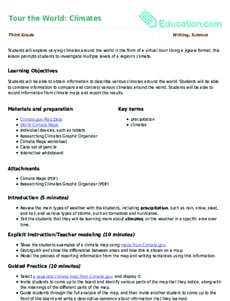
Tour the World: Climates
Third Grade
Measurement
Students will explore varying climates around the world in the form of a virtual tour! Using a jigsaw format, this lesson prompts students to investigate multiple levels of a region’s climate.
Lesson Plan
Tour the World: Climates
Lesson Plan
Tour the World: Climates
Students will explore varying climates around the world in the form of a virtual tour! Using a jigsaw format, this lesson prompts students to investigate multiple levels of a region’s climate.
Third Grade
Measurement
Lesson Plan
Exploring Probability: What Are The Chances?
Lesson Plan
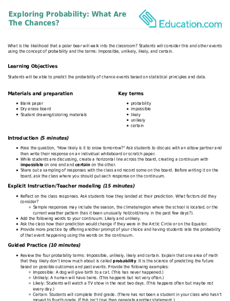
Exploring Probability: What Are The Chances?
Third Grade
Probability
What is the likelihood that a polar bear will walk into the classroom? Students will consider this and other events using the concept of probability and the terms: Impossible, unlikely, likely, and certain.
Lesson Plan
Exploring Probability: What Are The Chances?
Lesson Plan
Exploring Probability: What Are The Chances?
What is the likelihood that a polar bear will walk into the classroom? Students will consider this and other events using the concept of probability and the terms: Impossible, unlikely, likely, and certain.
Third Grade
Probability
Lesson Plan
Mean, Median and Mode Madness!
Lesson Plan
Mean, Median and Mode Madness!
Third Grade
Data and Graphing
This lesson introduces students to the concepts of mean, median, and mode in a hands-on and visual way.
Lesson Plan
Mean, Median and Mode Madness!
Lesson Plan
Mean, Median and Mode Madness!
This lesson introduces students to the concepts of mean, median, and mode in a hands-on and visual way.
Third Grade
Data and Graphing
Lesson Plan
1