SKIP TO CONTENT
Worksheet Generator
Subjects
Grades
Worksheets
Games
Build a Worksheet
More Resources
Roly Recommends
Subjects
Grades
Worksheets
Games
Build a Worksheet
More Resources
Roly Recommends
All Subjects
Math
Data and Graphing
Subtopics:
Collecting and Organizing Data
Picture Graphs
Bar Graphs
Line Plots
Coordinate Plane
Show Less
Filters
Search for: visual, learning, children
✕
Math
✕
2nd - 5th Grade
✕
Subjects
Math
English Language Arts
Science
Social Studies
Foreign Language
Grade Level
Pre-K
K
1st
2nd
3rd
4th
5th
6th
7th
8th
Early Childhood
Elementary School
Middle School
Resource Type
Worksheets
Games
Lesson Plans
Activities
Exercises
Offline Games
Guided Lessons
Occasion
Birthdays
St. Patrick's Day
Summer
Back to School
Holidays
Christmas
Hanukkah
Valentine's Day
Common Core
Yes
English Language Support
Yes
See More
Clear All
View 63 results
Showing Results for visual learning children
63 results
Search for: visual, learning, children
✕
Math
✕
2nd - 5th Grade
✕
Clear All
Sort by:
Relevance
Most recent
Most popular
Alphabetical A-Z
Alphabetical Z-A
All filters
63 results
Sort by:
Relevance
Most recent
Most popular
Alphabetical A-Z
Alphabetical Z-A
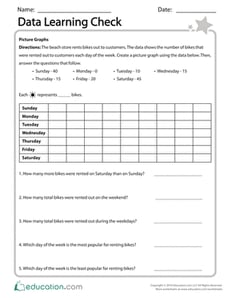
Data Learning Check
Worksheet
Data Learning Check
Third Grade
Data and Graphing
Use this resource to assess your students’ mastery of concepts surrounding data and graphs.
Worksheet
Data Learning Check
Worksheet
Data Learning Check
Use this resource to assess your students’ mastery of concepts surrounding data and graphs.
Third Grade
Data and Graphing
Worksheet
Intro to Probability: Marbles
Worksheet
Intro to Probability: Marbles
Fourth Grade
Data and Graphing
Introduce your students to probability concepts and fractions with a helpful and familiar visual aide.
Worksheet
Intro to Probability: Marbles
Worksheet
Intro to Probability: Marbles
Introduce your students to probability concepts and fractions with a helpful and familiar visual aide.
Fourth Grade
Data and Graphing
Worksheet
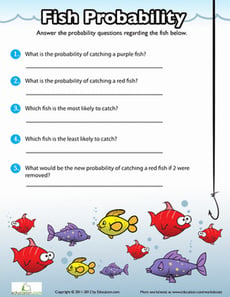
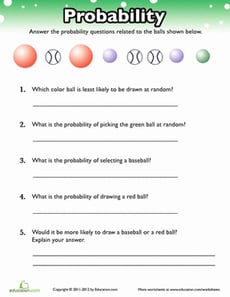
Probability Practice: Fish
Worksheet
Probability Practice: Fish
Fourth Grade
Data and Graphing
What kind of fish would you like to catch? Help your child master the concept of probability with this fun, visual exercise!
Worksheet
Probability Practice: Fish
Worksheet
Probability Practice: Fish
What kind of fish would you like to catch? Help your child master the concept of probability with this fun, visual exercise!
Fourth Grade
Data and Graphing
Worksheet
Probability Practice: Worms
Worksheet
Probability Practice: Worms
Fourth Grade
Data and Graphing
The early bird gets the worm! But which one will he choose? Have your child practice determining probability with a fun, visual exercise.
Worksheet
Probability Practice: Worms
Worksheet
Probability Practice: Worms
The early bird gets the worm! But which one will he choose? Have your child practice determining probability with a fun, visual exercise.
Fourth Grade
Data and Graphing
Worksheet
Measurement and Data 4
Guided Lesson
Measurement and Data 4
Fourth Grade
Fractions
Representing data on graphs makes math visual and involves some creativity and design. Plotting data using fractional units takes their learning one step further. Also in this unit, students learn to measure using both traditional units (like inches, feet and yards) and metric units, and how to convert measurements within each system. The concept of measurement gets two dimensional when students explore measuring and working with angles.
Guided Lesson
Measurement and Data 4
Guided Lesson
Measurement and Data 4
Representing data on graphs makes math visual and involves some creativity and design. Plotting data using fractional units takes their learning one step further. Also in this unit, students learn to measure using both traditional units (like inches, feet and yards) and metric units, and how to convert measurements within each system. The concept of measurement gets two dimensional when students explore measuring and working with angles.
Fourth Grade
Fractions
Guided Lesson
Mean, Median and Mode Madness!
Lesson Plan
Mean, Median and Mode Madness!
Third Grade
Data and Graphing
This lesson introduces students to the concepts of mean, median, and mode in a hands-on and visual way.
Lesson Plan
Mean, Median and Mode Madness!
Lesson Plan
Mean, Median and Mode Madness!
This lesson introduces students to the concepts of mean, median, and mode in a hands-on and visual way.
Third Grade
Data and Graphing
Lesson Plan
Winter Sports: Practice Reading a Bar Graph
Worksheet
Winter Sports: Practice Reading a Bar Graph
Second Grade
Data and Graphing
Children will practice interpreting a bar graph in this winter sports–themed math worksheet.
Worksheet
Winter Sports: Practice Reading a Bar Graph
Worksheet
Winter Sports: Practice Reading a Bar Graph
Children will practice interpreting a bar graph in this winter sports–themed math worksheet.
Second Grade
Data and Graphing
Worksheet
Gather Data: Record Your Favorites
Worksheet
Gather Data: Record Your Favorites
Second Grade
Data and Graphing
Use this helpful math worksheet to support children in gathering and organizing data so they can create and interpret graphs.
Worksheet
Gather Data: Record Your Favorites
Worksheet
Gather Data: Record Your Favorites
Use this helpful math worksheet to support children in gathering and organizing data so they can create and interpret graphs.
Second Grade
Data and Graphing
Worksheet
Probability and Statistics 1
Exercise
Probability and Statistics 1
Third Grade
Data and Graphing
This engaging exercise will introduce students to probability and statistics in a way that excites them to continue learning.
Exercise
Probability and Statistics 1
Exercise
Probability and Statistics 1
This engaging exercise will introduce students to probability and statistics in a way that excites them to continue learning.
Third Grade
Data and Graphing
Exercise
Graph Math
Activity
Graph Math
Fifth Grade
Data and Graphing
Increase your child's confidence in interpreting bar graphs and throw a little candy into the mix to sweeten the learning process.
Activity
Graph Math
Activity
Graph Math
Increase your child's confidence in interpreting bar graphs and throw a little candy into the mix to sweeten the learning process.
Fifth Grade
Data and Graphing
Activity
Reading a Bar Graph: Number of Athletes
Worksheet
Reading a Bar Graph: Number of Athletes
Third Grade
Data and Graphing
In this sports-themed worksheet, children use a bar graph to answer six questions about the number of athletes playing at a time in a variety of sporting events.
Worksheet
Reading a Bar Graph: Number of Athletes
Worksheet
Reading a Bar Graph: Number of Athletes
In this sports-themed worksheet, children use a bar graph to answer six questions about the number of athletes playing at a time in a variety of sporting events.
Third Grade
Data and Graphing
Worksheet
Data 2
Guided Lesson
Data 2
Fifth Grade
Fractions
Understanding data and graphs is a critical skill that we use on a regular basis to read news articles, reports and other media to interpret information. In this unit, students investigate data collection, data organization and visual representation in different kinds of graphics (i.e. line plots, pie charts). Learners also apply concepts of probability and statistics to analyze data.
Guided Lesson
Data 2
Guided Lesson
Data 2
Understanding data and graphs is a critical skill that we use on a regular basis to read news articles, reports and other media to interpret information. In this unit, students investigate data collection, data organization and visual representation in different kinds of graphics (i.e. line plots, pie charts). Learners also apply concepts of probability and statistics to analyze data.
Fifth Grade
Fractions
Guided Lesson
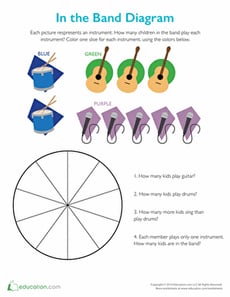
In the Band Pie Graph
Worksheet
In the Band Pie Graph
Second Grade
Data and Graphing
Rock out with this pie chart! Enjoy learning how to make a pie graph and interpret data while answering questions based on the information given.
Worksheet
In the Band Pie Graph
Worksheet
In the Band Pie Graph
Rock out with this pie chart! Enjoy learning how to make a pie graph and interpret data while answering questions based on the information given.
Second Grade
Data and Graphing
Worksheet
Leprechaun Chase
Activity
Leprechaun Chase
Fifth Grade
Geometry
This St. Patrick's day, stretch your child's social studies and math skills with this fun, cooperative learning game.
Activity
Leprechaun Chase
Activity
Leprechaun Chase
This St. Patrick's day, stretch your child's social studies and math skills with this fun, cooperative learning game.
Fifth Grade
Geometry
Activity
Olympic Math: High Jump
Worksheet
Olympic Math: High Jump
Fifth Grade
Data and Graphing
Jump over the hurdles of math by learning mode, median and mean. Use knowledge of data analysis to put each country's scores in a graph and award the winners!
Worksheet
Olympic Math: High Jump
Worksheet
Olympic Math: High Jump
Jump over the hurdles of math by learning mode, median and mean. Use knowledge of data analysis to put each country's scores in a graph and award the winners!
Fifth Grade
Data and Graphing
Worksheet
Why Do Leaves Change Color?
Activity
Why Do Leaves Change Color?
Second Grade
Data and Graphing
Engage your children with this fun fall activity that integrates math and science. First, your child will excavate to find leaves. Next, they'll examine them to determine the colors. Then, your child will graph their findings.
Activity
Why Do Leaves Change Color?
Activity
Why Do Leaves Change Color?
Engage your children with this fun fall activity that integrates math and science. First, your child will excavate to find leaves. Next, they'll examine them to determine the colors. Then, your child will graph their findings.
Second Grade
Data and Graphing
Activity
Data 1
Guided Lesson
Data 1
Third Grade
Fractions
Learning how to represent numerical information is a key part of the third grade math curriculum. This lesson in data provides guided instruction designed by our team of curriculum experts and teachers to present this concept in an engaging way. Not only that, but helpful exercises help kids to see the practical applicaton of these skills in the real world.
Guided Lesson
Data 1
Guided Lesson
Data 1
Learning how to represent numerical information is a key part of the third grade math curriculum. This lesson in data provides guided instruction designed by our team of curriculum experts and teachers to present this concept in an engaging way. Not only that, but helpful exercises help kids to see the practical applicaton of these skills in the real world.
Third Grade
Fractions
Guided Lesson
Intro to Probability: Playing Cards
Worksheet
Intro to Probability: Playing Cards
Fourth Grade
Data and Graphing
We don't condone gambling, but here's a fun worksheet to learn probability with playing cards.
Worksheet
Intro to Probability: Playing Cards
Worksheet
Intro to Probability: Playing Cards
We don't condone gambling, but here's a fun worksheet to learn probability with playing cards.
Fourth Grade
Data and Graphing
Worksheet
Intro to Probability: Utensils
Worksheet
Intro to Probability: Utensils
Fourth Grade
Data and Graphing
Serve yourself some knowledge with this probability worksheet! This great page will introduce your child to probability concepts.
Worksheet
Intro to Probability: Utensils
Worksheet
Intro to Probability: Utensils
Serve yourself some knowledge with this probability worksheet! This great page will introduce your child to probability concepts.
Fourth Grade
Data and Graphing
Worksheet
Probability Practice
Worksheet
Probability Practice
Fourth Grade
Data and Graphing
Get some practice with probability! With this exercise, your child will practice using fractions to express probability of different outcomes.
Worksheet
Probability Practice
Worksheet
Probability Practice
Get some practice with probability! With this exercise, your child will practice using fractions to express probability of different outcomes.
Fourth Grade
Data and Graphing
Worksheet
Probability: Days of the Week
Worksheet
Probability: Days of the Week
Fourth Grade
Data and Graphing
Practice probability with the days of the week! Your child will learn to find the probability of picking a random day on the calendar.
Worksheet
Probability: Days of the Week
Worksheet
Probability: Days of the Week
Practice probability with the days of the week! Your child will learn to find the probability of picking a random day on the calendar.
Fourth Grade
Data and Graphing
Worksheet
Musical Instruments Pie Chart
Worksheet
Musical Instruments Pie Chart
Second Grade
Data and Graphing
Pie makes pretty much anything better, especially math. Help your kid learn about graphs with this nonthreatening pie chart featuring musical instruments.
Worksheet
Musical Instruments Pie Chart
Worksheet
Musical Instruments Pie Chart
Pie makes pretty much anything better, especially math. Help your kid learn about graphs with this nonthreatening pie chart featuring musical instruments.
Second Grade
Data and Graphing
Worksheet
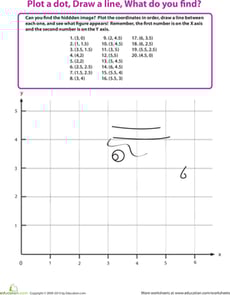
Plot the Coordinates to Draw a Picture
Worksheet
Plot the Coordinates to Draw a Picture
Fifth Grade
Data and Graphing
Your child will learn about coordinates, plot points, connect the dots, and draw a silly picture!
Worksheet
Plot the Coordinates to Draw a Picture
Worksheet
Plot the Coordinates to Draw a Picture
Your child will learn about coordinates, plot points, connect the dots, and draw a silly picture!
Fifth Grade
Data and Graphing
Worksheet
Flower Pie Chart
Worksheet
Flower Pie Chart
Second Grade
Data and Graphing
Even if your child isn't ready for statistics, he can learn to get his bearings around charts and graphs with this simple flower-themed pie chart worksheet.
Worksheet
Flower Pie Chart
Worksheet
Flower Pie Chart
Even if your child isn't ready for statistics, he can learn to get his bearings around charts and graphs with this simple flower-themed pie chart worksheet.
Second Grade
Data and Graphing
Worksheet
Bar Graph: Getting to School
Worksheet
Bar Graph: Getting to School
Third Grade
Data and Graphing
Kids completing this third grade math worksheet use a bar graph to compare data about transportation to school and solve addition and subtraction problems.
Worksheet
Bar Graph: Getting to School
Worksheet
Bar Graph: Getting to School
Kids completing this third grade math worksheet use a bar graph to compare data about transportation to school and solve addition and subtraction problems.
Third Grade
Data and Graphing
Worksheet
Create a Line Plot with Data Provided
Worksheet
Create a Line Plot with Data Provided
Third Grade
Data and Graphing
Use the data provided to have your students create a line plot that reflects how much TV watched per week for one third grade class.
Worksheet
Create a Line Plot with Data Provided
Worksheet
Create a Line Plot with Data Provided
Use the data provided to have your students create a line plot that reflects how much TV watched per week for one third grade class.
Third Grade
Data and Graphing
Worksheet
Foot Length: Create a Line Plot with Fractional Units
Worksheet
Foot Length: Create a Line Plot with Fractional Units
Fourth Grade
Data and Graphing
This worksheet challenges third graders to interpret the data and create a line plot with fractions, a key skill for fourth grade math.
Worksheet
Foot Length: Create a Line Plot with Fractional Units
Worksheet
Foot Length: Create a Line Plot with Fractional Units
This worksheet challenges third graders to interpret the data and create a line plot with fractions, a key skill for fourth grade math.
Fourth Grade
Data and Graphing
Worksheet
Do a Survey! Favorite Veggies
Worksheet
Do a Survey! Favorite Veggies
Second Grade
Data and Graphing
Give your second grader some practice working with data with this fun-to-complete favorite veggie survey.
Worksheet
Do a Survey! Favorite Veggies
Worksheet
Do a Survey! Favorite Veggies
Give your second grader some practice working with data with this fun-to-complete favorite veggie survey.
Second Grade
Data and Graphing
Worksheet
Create a Line Plot (With Your Own Data!)
Worksheet
Create a Line Plot (With Your Own Data!)
Second Grade
Data and Graphing
Invite students to become researchers with this open-ended line plot template!
Worksheet
Create a Line Plot (With Your Own Data!)
Worksheet
Create a Line Plot (With Your Own Data!)
Invite students to become researchers with this open-ended line plot template!
Second Grade
Data and Graphing
Worksheet
Draw a Birthday Bar Graph
Activity
Draw a Birthday Bar Graph
Third Grade
Data and Graphing
Liven up a lesson about graphing by helping your third grader compile a bar graph from his classmates' birthday data.
Activity
Draw a Birthday Bar Graph
Activity
Draw a Birthday Bar Graph
Liven up a lesson about graphing by helping your third grader compile a bar graph from his classmates' birthday data.
Third Grade
Data and Graphing
Activity
1
2
3