SKIP TO CONTENT
Worksheet Generator
Subjects
Grades
Worksheets
Games
Build a Worksheet
More Resources
Roly Recommends
Subjects
Grades
Worksheets
Games
Build a Worksheet
More Resources
Roly Recommends
All Subjects
Math
Data and Graphing
Subtopics:
Collecting and Organizing Data
Picture Graphs
Bar Graphs
Line Plots
Show Less
Filters
Search for: article, write, super, hero, comic, strip, 2
✕
Math
✕
Kindergarten - 4th Grade
✕
Subjects
Math
English Language Arts
Science
Social Studies
Foreign Language
Grade Level
Pre-K
K
1st
2nd
3rd
4th
5th
6th
7th
8th
Early Childhood
Elementary School
Middle School
Resource Type
Worksheets
Games
Lesson Plans
Interactive Worksheets
Workbooks
Activities
Exercises
Offline Games
Guided Lessons
Occasion
Birthdays
Summer
Halloween
Holidays
Lunar New Year
Valentine's Day
Common Core
Yes
Game Type
Ball Games
Arts & Crafts
Arts & Crafts
Paper & Glue Crafts
Construction & Sculpture
Painting & Drawing
English Language Support
Yes
See More
Clear All
View 78 results
Showing Results for article write super hero comic strip 2 : Page 2
78 results
Search for: article, write, super, hero, comic, strip, 2
✕
Math
✕
Kindergarten - 4th Grade
✕
Clear All
Sort by:
Relevance
Most recent
Most popular
Alphabetical A-Z
Alphabetical Z-A
All filters
78 results
Sort by:
Relevance
Most recent
Most popular
Alphabetical A-Z
Alphabetical Z-A
What is it Telling Me? Creating and Interpreting Line Plots
Lesson Plan
What is it Telling Me? Creating and Interpreting Line Plots
Third Grade
Data and Graphing
Line plots are a great way to introduce your students to graphing data. In this lesson, your students will learn how to create a line plot and also practice interpreting line plots.
Lesson Plan
What is it Telling Me? Creating and Interpreting Line Plots
Lesson Plan
What is it Telling Me? Creating and Interpreting Line Plots
Line plots are a great way to introduce your students to graphing data. In this lesson, your students will learn how to create a line plot and also practice interpreting line plots.
Third Grade
Data and Graphing
Lesson Plan
Chalk it Up! An Outdoor Classification Activity
Activity
Chalk it Up! An Outdoor Classification Activity
First Grade
Place Value
Get your child math and science savvy with this fun outdoor classification game. Using chalk, your child will classify what she sees in the natural world.
Activity
Chalk it Up! An Outdoor Classification Activity
Activity
Chalk it Up! An Outdoor Classification Activity
Get your child math and science savvy with this fun outdoor classification game. Using chalk, your child will classify what she sees in the natural world.
First Grade
Place Value
Activity
Mighty Mean, Median, and Mode
Lesson Plan
Mighty Mean, Median, and Mode
Fourth Grade
Data and Graphing
Give your students a good basis in interpreting data with this lesson that teaches them about mean, median, and mode with plenty of practice and cute videos to keep them interested.
Lesson Plan
Mighty Mean, Median, and Mode
Lesson Plan
Mighty Mean, Median, and Mode
Give your students a good basis in interpreting data with this lesson that teaches them about mean, median, and mode with plenty of practice and cute videos to keep them interested.
Fourth Grade
Data and Graphing
Lesson Plan
Study of Names
Activity
Study of Names
Third Grade
Data and Graphing
Graph are a great way to organize information. Your child will get to practice graphing by creating a bar graph and a pictorial graph of her friend's names.
Activity
Study of Names
Activity
Study of Names
Graph are a great way to organize information. Your child will get to practice graphing by creating a bar graph and a pictorial graph of her friend's names.
Third Grade
Data and Graphing
Activity
EL
Nature Counting
Lesson Plan
Nature Counting
Kindergarten
Data and Graphing
Use this fun lesson plan to introduce or review the concept of addition to your ELs. Can be used as a stand alone or support lesson for the
Nature and Counting It All Adds Up
lesson plan.
Lesson Plan
EL
Nature Counting
Lesson Plan
Nature Counting
Use this fun lesson plan to introduce or review the concept of addition to your ELs. Can be used as a stand alone or support lesson for the
Nature and Counting It All Adds Up
lesson plan.
Kindergarten
Data and Graphing
Lesson Plan
Draw a Birthday Bar Graph
Activity
Draw a Birthday Bar Graph
Third Grade
Data and Graphing
Liven up a lesson about graphing by helping your third grader compile a bar graph from his classmates' birthday data.
Activity
Draw a Birthday Bar Graph
Activity
Draw a Birthday Bar Graph
Liven up a lesson about graphing by helping your third grader compile a bar graph from his classmates' birthday data.
Third Grade
Data and Graphing
Activity
Do We Wear the Same Colors?
Activity
Do We Wear the Same Colors?
Third Grade
Data and Graphing
Hone observational skills and introduce the basics of data interpretation with this data gathering activity all about the different colors people wear.
Activity
Do We Wear the Same Colors?
Activity
Do We Wear the Same Colors?
Hone observational skills and introduce the basics of data interpretation with this data gathering activity all about the different colors people wear.
Third Grade
Data and Graphing
Activity
Bounce that Ball: Learn Math While Doing Sports
Activity
Bounce that Ball: Learn Math While Doing Sports
First Grade
Data and Graphing
Head out to the driveway, ball in hand, for a bouncing challenge. Then use those results to make a colorful graph that lets your child compare results.
Activity
Bounce that Ball: Learn Math While Doing Sports
Activity
Bounce that Ball: Learn Math While Doing Sports
Head out to the driveway, ball in hand, for a bouncing challenge. Then use those results to make a colorful graph that lets your child compare results.
First Grade
Data and Graphing
Activity
Dice Probability
Activity
Dice Probability
Fourth Grade
Data and Graphing
Analyze this simple betting game with your fourth grade student in order to discuss probability.
Activity
Dice Probability
Activity
Dice Probability
Analyze this simple betting game with your fourth grade student in order to discuss probability.
Fourth Grade
Data and Graphing
Activity
Spot The Difference
Game
Spot The Difference
Kindergarten
Data and Graphing
Game
Spot The Difference
Game
Spot The Difference
Kindergarten
Data and Graphing
Game
Let's Graph Our Fall Favorites!
Lesson Plan
Let's Graph Our Fall Favorites!
Second Grade
Data and Graphing
This engaging math lesson combines all of your kid's fall favorites as they learn to represent data using a bar graph.
Lesson Plan
Let's Graph Our Fall Favorites!
Lesson Plan
Let's Graph Our Fall Favorites!
This engaging math lesson combines all of your kid's fall favorites as they learn to represent data using a bar graph.
Second Grade
Data and Graphing
Lesson Plan
Less Than or Greater Than: 1 to 20
Game
Less Than or Greater Than: 1 to 20
First Grade
Numbers and Counting
The alligators are hungry for numbers, and kids use number skills to feed them.
Game
Less Than or Greater Than: 1 to 20
Game
Less Than or Greater Than: 1 to 20
The alligators are hungry for numbers, and kids use number skills to feed them.
First Grade
Numbers and Counting
Game
EL
Graph My Design
Lesson Plan
Graph My Design
First Grade
Geometry
Geometry meets data in this fun lesson! Students will build a design using pattern blocks and then graph the number of each shape used. This scaffolded EL lesson can be used alone or alongside
Graphing Colored Counters.
Lesson Plan
EL
Graph My Design
Lesson Plan
Graph My Design
Geometry meets data in this fun lesson! Students will build a design using pattern blocks and then graph the number of each shape used. This scaffolded EL lesson can be used alone or alongside
Graphing Colored Counters.
First Grade
Geometry
Lesson Plan
Make Math Fun with Buttons!
Activity
Make Math Fun with Buttons!
Kindergarten
Place Value
Have a lot of loose buttons lying around the house? Here are four ways to turn those loose buttons into an easy and positive learning experience. Button up!
Activity
Make Math Fun with Buttons!
Activity
Make Math Fun with Buttons!
Have a lot of loose buttons lying around the house? Here are four ways to turn those loose buttons into an easy and positive learning experience. Button up!
Kindergarten
Place Value
Activity
Pictograph Practice: Hamburger Cafe
Worksheet
Pictograph Practice: Hamburger Cafe
Second Grade
Data and Graphing
Pictographs are a great introduction to working with data and graphs. Kids help the hamburger cafe compare the number of hamburgers they sold using pictographs.
Worksheet
Pictograph Practice: Hamburger Cafe
Worksheet
Pictograph Practice: Hamburger Cafe
Pictographs are a great introduction to working with data and graphs. Kids help the hamburger cafe compare the number of hamburgers they sold using pictographs.
Second Grade
Data and Graphing
Worksheet
Create a Family Graph!
Activity
Create a Family Graph!
Third Grade
Data and Graphing
Create a graph based on the interests of family member's to see who has what in common. Your child will practice her math skills and get to know the family!
Activity
Create a Family Graph!
Activity
Create a Family Graph!
Create a graph based on the interests of family member's to see who has what in common. Your child will practice her math skills and get to know the family!
Third Grade
Data and Graphing
Activity
Mean, Median and Mode Madness!
Lesson Plan
Mean, Median and Mode Madness!
Third Grade
Data and Graphing
This lesson introduces students to the concepts of mean, median, and mode in a hands-on and visual way.
Lesson Plan
Mean, Median and Mode Madness!
Lesson Plan
Mean, Median and Mode Madness!
This lesson introduces students to the concepts of mean, median, and mode in a hands-on and visual way.
Third Grade
Data and Graphing
Lesson Plan
Mid-Year Math Assessment: Sorting Objects
Worksheet
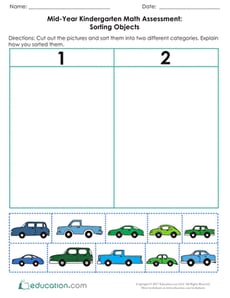
Mid-Year Math Assessment: Sorting Objects
Kindergarten
Data and Graphing
Assess your students’ understanding of sorting and categorizing using this helpful worksheet focusing on color, size, and number.
Worksheet
Mid-Year Math Assessment: Sorting Objects
Worksheet
Mid-Year Math Assessment: Sorting Objects
Assess your students’ understanding of sorting and categorizing using this helpful worksheet focusing on color, size, and number.
Kindergarten
Data and Graphing
Worksheet
Become a "Coin Archaeologist"
Activity
Become a "Coin Archaeologist"
Kindergarten
Data and Graphing
Here's a math, science, and social studies activity: help your kindergartener become a "coin archaeologist" by examining how different coins look and feel.
Activity
Become a "Coin Archaeologist"
Activity
Become a "Coin Archaeologist"
Here's a math, science, and social studies activity: help your kindergartener become a "coin archaeologist" by examining how different coins look and feel.
Kindergarten
Data and Graphing
Activity
2D and 3D Shape Sort: Factory
Game
2D and 3D Shape Sort: Factory
Kindergarten
Geometry
Kids sort 2D and 3D shapes in this engaging geometry game.
Game
2D and 3D Shape Sort: Factory
Game
2D and 3D Shape Sort: Factory
Kids sort 2D and 3D shapes in this engaging geometry game.
Kindergarten
Geometry
Game
Zap and Kreb: Graphing Word Problems
Game
Zap and Kreb: Graphing Word Problems
Third Grade
Data and Graphing
Kids journey to Earth with aliens Zap and Kreb on a mission to gather data and create graphs in a math story that's out of this world!
Game
Zap and Kreb: Graphing Word Problems
Game
Zap and Kreb: Graphing Word Problems
Kids journey to Earth with aliens Zap and Kreb on a mission to gather data and create graphs in a math story that's out of this world!
Third Grade
Data and Graphing
Game
Interpreting Data Using Graphs
Lesson Plan
Interpreting Data Using Graphs
Kindergarten
Data and Graphing
Engage students in learning about data by analyzing picture graphs, then collecting data from classmates and making their own graphs!
Lesson Plan
Interpreting Data Using Graphs
Lesson Plan
Interpreting Data Using Graphs
Engage students in learning about data by analyzing picture graphs, then collecting data from classmates and making their own graphs!
Kindergarten
Data and Graphing
Lesson Plan
Favorite Foods
Worksheet
Favorite Foods
First Grade
Data and Graphing
Your child can learn to create a bar graph while having fun asking people questions.
Worksheet
Favorite Foods
Worksheet
Favorite Foods
Your child can learn to create a bar graph while having fun asking people questions.
First Grade
Data and Graphing
Worksheet
Bar Graphs: Interpreting Data
Lesson Plan
Bar Graphs: Interpreting Data
Second Grade
Data and Graphing
In this lesson, students will make bar graphs and interpret data using real-life data from other students. They will get practice writing and answering survey questions.
Lesson Plan
Bar Graphs: Interpreting Data
Lesson Plan
Bar Graphs: Interpreting Data
In this lesson, students will make bar graphs and interpret data using real-life data from other students. They will get practice writing and answering survey questions.
Second Grade
Data and Graphing
Lesson Plan
Tally Time: At the Farmers Market
Worksheet
Tally Time: At the Farmers Market
First Grade
Data and Graphing
The farmer needs help keeping track of his vegetables. Can your child use her counting skills to give him a hand?
Worksheet
Tally Time: At the Farmers Market
Worksheet
Tally Time: At the Farmers Market
The farmer needs help keeping track of his vegetables. Can your child use her counting skills to give him a hand?
First Grade
Data and Graphing
Worksheet
Practice Reading Venn Diagrams #3: Favorite Dessert
Worksheet
Practice Reading Venn Diagrams #3: Favorite Dessert
Second Grade
Data and Graphing
Kids practice reading a Venn diagram about favorite desserts and answer questions about it in this 2nd grade math worksheet.
Worksheet
Practice Reading Venn Diagrams #3: Favorite Dessert
Worksheet
Practice Reading Venn Diagrams #3: Favorite Dessert
Kids practice reading a Venn diagram about favorite desserts and answer questions about it in this 2nd grade math worksheet.
Second Grade
Data and Graphing
Worksheet
Math + Love = Valentine's Day Bar Graph
Lesson Plan
Math + Love = Valentine's Day Bar Graph
Second Grade
Data and Graphing
What's more romantic than a bar graph on Valentine's Day? In this Valentine's Day lesson plan, students will use information from a data set to create their own tally charts and bar graphs and then analyze these graphs to answer questions.
Lesson Plan
Math + Love = Valentine's Day Bar Graph
Lesson Plan
Math + Love = Valentine's Day Bar Graph
What's more romantic than a bar graph on Valentine's Day? In this Valentine's Day lesson plan, students will use information from a data set to create their own tally charts and bar graphs and then analyze these graphs to answer questions.
Second Grade
Data and Graphing
Lesson Plan
Creating a Bar Graph: Favorite Picnic Spots
Worksheet
Creating a Bar Graph: Favorite Picnic Spots
Second Grade
Data and Graphing
Learners practice charting and graphing data in this hands-on worksheet.
Worksheet
Creating a Bar Graph: Favorite Picnic Spots
Worksheet
Creating a Bar Graph: Favorite Picnic Spots
Learners practice charting and graphing data in this hands-on worksheet.
Second Grade
Data and Graphing
Worksheet
Candy Counter
Activity
Candy Counter
First Grade
Numbers and Counting
Does your kid have a stash of sweets left over from Halloween? Turn that pile of candy into a learning opportunity with this sorting and categorizing activity.
Activity
Candy Counter
Activity
Candy Counter
Does your kid have a stash of sweets left over from Halloween? Turn that pile of candy into a learning opportunity with this sorting and categorizing activity.
First Grade
Numbers and Counting
Activity
Heart Hunt: Count and Graph
Worksheet
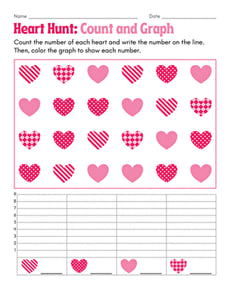
Heart Hunt: Count and Graph
Kindergarten
Numbers and Counting
Hunt for decorative hearts in this Valentine’s Day-themed graphing worksheet for kindergarteners and first graders!
Worksheet
Heart Hunt: Count and Graph
Worksheet
Heart Hunt: Count and Graph
Hunt for decorative hearts in this Valentine’s Day-themed graphing worksheet for kindergarteners and first graders!
Kindergarten
Numbers and Counting
Worksheet
1
2
3