SKIP TO CONTENT
Worksheet Generator
Subjects
Grades
Worksheets
Games
Build a Worksheet
More Resources
Roly Recommends
Reading Month
Subjects
Grades
Worksheets
Games
Build a Worksheet
More Resources
Roly Recommends
Reading Month
Filters
Search for: interpretting, data, using, graphs, recipes
✕
Lesson Plans
✕
1st - 4th Grade
✕
Subjects
Math
English Language Arts
Science
Social Studies
Grade Level
Pre-K
K
1st
2nd
3rd
4th
5th
6th
7th
8th
Early Childhood
Elementary School
Middle School
Resource Type
Worksheets
Games
Lesson Plans
Interactive Worksheets
Workbooks
Activities
Exercises
Stories
Songs
Offline Games
Guided Lessons
Teacher Resources
Common Core
Yes
Roly Recommends
Social Emotional Learning
English Language Support
Yes
See More
Clear All
View 1,290 results
Showing Results for interpretting data using graphs recipes
1,290 results
Search for: interpretting, data, using, graphs, recipes
✕
Lesson Plans
✕
1st - 4th Grade
✕
Clear All
Sort by:
Relevance
Most recent
Most popular
Alphabetical A-Z
Alphabetical Z-A
All filters
1,290 results
Sort by:
Relevance
Most recent
Most popular
Alphabetical A-Z
Alphabetical Z-A
Bar Graphs: Interpreting Data
Lesson Plan
Bar Graphs: Interpreting Data
Second Grade
Data and Graphing
In this lesson, students will make bar graphs and interpret data using real-life data from other students. They will get practice writing and answering survey questions.
Lesson Plan
Bar Graphs: Interpreting Data
Lesson Plan
Bar Graphs: Interpreting Data
In this lesson, students will make bar graphs and interpret data using real-life data from other students. They will get practice writing and answering survey questions.
Second Grade
Data and Graphing
Lesson Plan
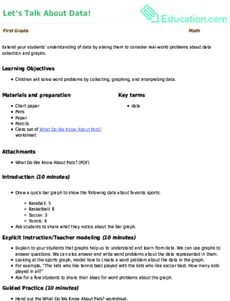
Let’s Talk About Data!
Lesson Plan
Let’s Talk About Data!
First Grade
Math
Extend your students' understanding of data by asking them to consider real-world problems about data collection and graphs.
Lesson Plan
Let’s Talk About Data!
Lesson Plan
Let’s Talk About Data!
Extend your students' understanding of data by asking them to consider real-world problems about data collection and graphs.
First Grade
Math
Lesson Plan
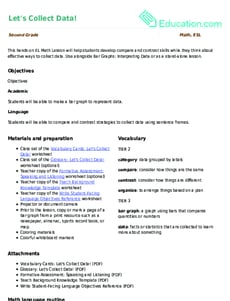
Let's Collect Data!
Lesson Plan
Let's Collect Data!
Second Grade
This hands-on EL Math Lesson will help students develop compare and contrast skills while they think about effective ways to collect data. Use alongside Bar Graphs: Interpreting Data or as a stand-alone lesson.
Lesson Plan
Let's Collect Data!
Lesson Plan
Let's Collect Data!
This hands-on EL Math Lesson will help students develop compare and contrast skills while they think about effective ways to collect data. Use alongside Bar Graphs: Interpreting Data or as a stand-alone lesson.
Second Grade
Lesson Plan
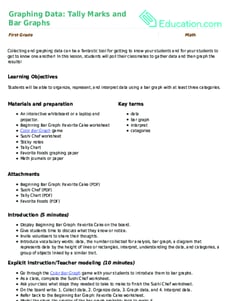
Graphing Data: Tally Marks and Bar Graphs
Lesson Plan
Graphing Data: Tally Marks and Bar Graphs
First Grade
Collecting and graphing data can be a fantastic tool for getting to know your students and for your students to get to know one another! In this lesson, students will poll their classmates to gather data and then graph the results!
Lesson Plan
Graphing Data: Tally Marks and Bar Graphs
Lesson Plan
Graphing Data: Tally Marks and Bar Graphs
Collecting and graphing data can be a fantastic tool for getting to know your students and for your students to get to know one another! In this lesson, students will poll their classmates to gather data and then graph the results!
First Grade
Lesson Plan
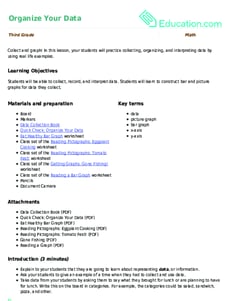
Organize Your Data
Lesson Plan
Organize Your Data
Third Grade
Collect and graph! In this lesson, your students will practice collecting, organizing, and interpreting data by using real life examples.
Lesson Plan
Organize Your Data
Lesson Plan
Organize Your Data
Collect and graph! In this lesson, your students will practice collecting, organizing, and interpreting data by using real life examples.
Third Grade
Lesson Plan
Interpreting Line Plots, Bar Graphs and Picture Graphs: Word Problems
Lesson Plan
Interpreting Line Plots, Bar Graphs and Picture Graphs: Word Problems
Third Grade
Graphs bring data to life and help us draw conclusions about the information. In this lesson, students will engage with three different kinds of graphs by asking and answering interpretive questions.
Lesson Plan
Interpreting Line Plots, Bar Graphs and Picture Graphs: Word Problems
Lesson Plan
Interpreting Line Plots, Bar Graphs and Picture Graphs: Word Problems
Graphs bring data to life and help us draw conclusions about the information. In this lesson, students will engage with three different kinds of graphs by asking and answering interpretive questions.
Third Grade
Lesson Plan
Making Bar Graphs: Graph It!
Lesson Plan
Making Bar Graphs: Graph It!
Second Grade
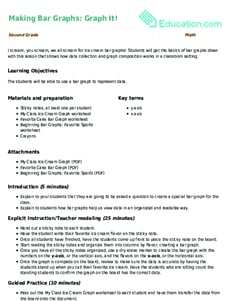
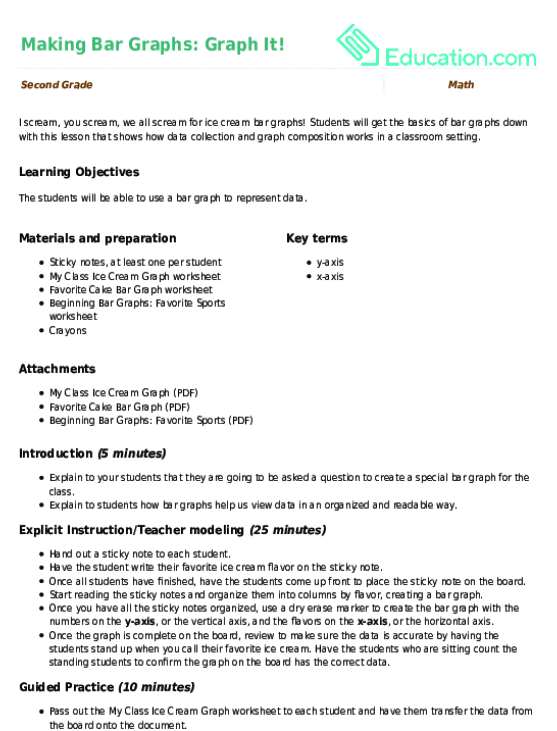
I scream, you scream, we all scream for ice cream bar graphs! Students will get the basics of bar graphs down with this lesson that shows how data collection and graph composition works in a classroom setting.
Lesson Plan
Making Bar Graphs: Graph It!
Lesson Plan
Making Bar Graphs: Graph It!
I scream, you scream, we all scream for ice cream bar graphs! Students will get the basics of bar graphs down with this lesson that shows how data collection and graph composition works in a classroom setting.
Second Grade
Lesson Plan
Heights on a Data Line Plot
Lesson Plan
Heights on a Data Line Plot
Third Grade
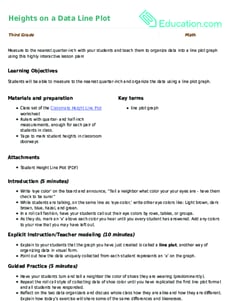
Measure to the nearest quarter-inch with your students and teach them to organize data into a line plot graph using this highly interactive lesson plan!
Lesson Plan
Heights on a Data Line Plot
Lesson Plan
Heights on a Data Line Plot
Measure to the nearest quarter-inch with your students and teach them to organize data into a line plot graph using this highly interactive lesson plan!
Third Grade
Lesson Plan
Asking and Answering Questions about Line Plots and Bar Graphs
Lesson Plan
Asking and Answering Questions about Line Plots and Bar Graphs
Third Grade
Take students’ understanding of bar graphs and line plots to the next level. This lesson will encourage students to think about how graphs are designed and the questions we can ask and answer about data presented in graphs.
Lesson Plan
Asking and Answering Questions about Line Plots and Bar Graphs
Lesson Plan
Asking and Answering Questions about Line Plots and Bar Graphs
Take students’ understanding of bar graphs and line plots to the next level. This lesson will encourage students to think about how graphs are designed and the questions we can ask and answer about data presented in graphs.
Third Grade
Lesson Plan
Let’s Find Out! Answering Questions by Collecting and Organizing Data
Lesson Plan
Let’s Find Out! Answering Questions by Collecting and Organizing Data
Third Grade
Your students will practice data collection and graphing while learning more about each other. Your data scientists will craft a survey question, collect data from the class, and then create a bar graph to represent their findings.
Lesson Plan
Let’s Find Out! Answering Questions by Collecting and Organizing Data
Lesson Plan
Let’s Find Out! Answering Questions by Collecting and Organizing Data
Your students will practice data collection and graphing while learning more about each other. Your data scientists will craft a survey question, collect data from the class, and then create a bar graph to represent their findings.
Third Grade
Lesson Plan
Creating Graphs: Classroom Scavengers
Lesson Plan
Creating Graphs: Classroom Scavengers
First Grade
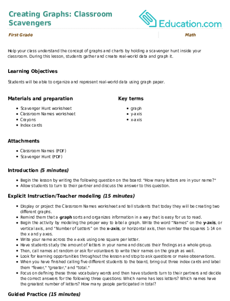
Help your class understand the concept of graphs and charts by holding a scavenger hunt inside your classroom. During this lesson, students gather and create real-world data and graph it.
Lesson Plan
Creating Graphs: Classroom Scavengers
Lesson Plan
Creating Graphs: Classroom Scavengers
Help your class understand the concept of graphs and charts by holding a scavenger hunt inside your classroom. During this lesson, students gather and create real-world data and graph it.
First Grade
Lesson Plan
Collect, Organize, and Discuss the Data
Lesson Plan
Collect, Organize, and Discuss the Data
Third Grade
Support your students as they collect, organize, and discuss measurement data! Use this lesson independently or alongside
Making Measurements for Line Plots
.
Lesson Plan
Collect, Organize, and Discuss the Data
Lesson Plan
Collect, Organize, and Discuss the Data
Support your students as they collect, organize, and discuss measurement data! Use this lesson independently or alongside
Making Measurements for Line Plots
.
Third Grade
Lesson Plan
What Does the Graph Show?
Lesson Plan
What Does the Graph Show?
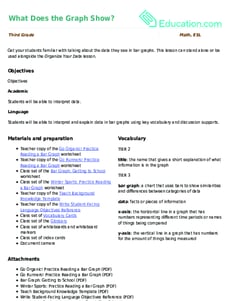
Third Grade
Get your students familiar with talking about the data they see in bar graphs. This lesson can stand alone or be used alongside the
Organize Your Data
lesson.
Lesson Plan
What Does the Graph Show?
Lesson Plan
What Does the Graph Show?
Get your students familiar with talking about the data they see in bar graphs. This lesson can stand alone or be used alongside the
Organize Your Data
lesson.
Third Grade
Lesson Plan
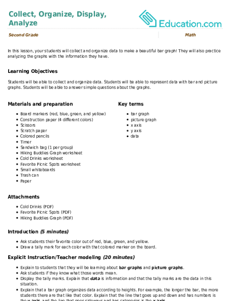
Collect, Organize, Display, Analyze
Lesson Plan
Collect, Organize, Display, Analyze
Second Grade
In this lesson, your students will collect and organize data to make a beautiful bar graph! They will also practice analyzing the graphs with the information they have.
Lesson Plan
Collect, Organize, Display, Analyze
Lesson Plan
Collect, Organize, Display, Analyze
In this lesson, your students will collect and organize data to make a beautiful bar graph! They will also practice analyzing the graphs with the information they have.
Second Grade
Lesson Plan
How Many More?
Lesson Plan
How Many More?
Second Grade
Subtraction is a lot more than just “take away.” In this lesson, students develop an understanding of subtraction as comparison by creating and interpreting data from bar graphs.
Lesson Plan
How Many More?
Lesson Plan
How Many More?
Subtraction is a lot more than just “take away.” In this lesson, students develop an understanding of subtraction as comparison by creating and interpreting data from bar graphs.
Second Grade
Lesson Plan
Math + Love = Valentine's Day Bar Graph
Lesson Plan
Math + Love = Valentine's Day Bar Graph
Second Grade
Data and Graphing
What's more romantic than a bar graph on Valentine's Day? In this Valentine's Day lesson plan, students will use information from a data set to create their own tally charts and bar graphs and then analyze these graphs to answer questions.
Lesson Plan
Math + Love = Valentine's Day Bar Graph
Lesson Plan
Math + Love = Valentine's Day Bar Graph
What's more romantic than a bar graph on Valentine's Day? In this Valentine's Day lesson plan, students will use information from a data set to create their own tally charts and bar graphs and then analyze these graphs to answer questions.
Second Grade
Data and Graphing
Lesson Plan
Let's Graph Our Fall Favorites!
Lesson Plan
Let's Graph Our Fall Favorites!
Second Grade
Data and Graphing
This engaging math lesson combines all of your kid's fall favorites as they learn to represent data using a bar graph.
Lesson Plan
Let's Graph Our Fall Favorites!
Lesson Plan
Let's Graph Our Fall Favorites!
This engaging math lesson combines all of your kid's fall favorites as they learn to represent data using a bar graph.
Second Grade
Data and Graphing
Lesson Plan
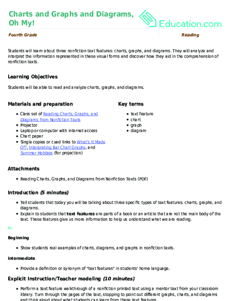
Charts and Graphs and Diagrams, Oh My!
Lesson Plan
Charts and Graphs and Diagrams, Oh My!
Fourth Grade
Reading
Students will learn about three nonfiction text features: charts, graphs, and diagrams. They will analyze and interpret the information represented in these visual forms and discover how they aid in the comprehension of nonfiction texts.
Lesson Plan
Charts and Graphs and Diagrams, Oh My!
Lesson Plan
Charts and Graphs and Diagrams, Oh My!
Students will learn about three nonfiction text features: charts, graphs, and diagrams. They will analyze and interpret the information represented in these visual forms and discover how they aid in the comprehension of nonfiction texts.
Fourth Grade
Reading
Lesson Plan
Let's Play Ball
Lesson Plan
Let's Play Ball
Third Grade
Multiplication
Students will have a ball with this data collection lesson plan where they learn about collecting and plotting data on a chart and line plot.
Lesson Plan
Let's Play Ball
Lesson Plan
Let's Play Ball
Students will have a ball with this data collection lesson plan where they learn about collecting and plotting data on a chart and line plot.
Third Grade
Multiplication
Lesson Plan
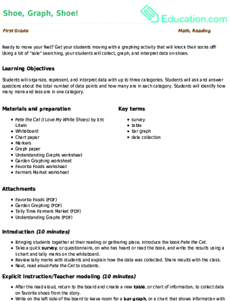
Shoe, Graph, Shoe!
Lesson Plan
Shoe, Graph, Shoe!
First Grade
Ready to move your feet? Get your students moving with a graphing activity that will knock their socks off! Using a bit of “sole” searching, your students will collect, graph, and interpret data on shoes.
Lesson Plan
Shoe, Graph, Shoe!
Lesson Plan
Shoe, Graph, Shoe!
Ready to move your feet? Get your students moving with a graphing activity that will knock their socks off! Using a bit of “sole” searching, your students will collect, graph, and interpret data on shoes.
First Grade
Lesson Plan
Researching the Past Using Primary Sources
Lesson Plan
Researching the Past Using Primary Sources
Fourth Grade
Reading
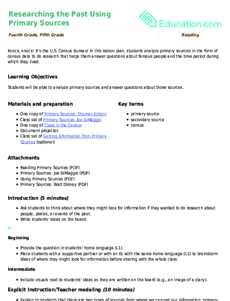
Knock, knock! It’s the U.S. Census Bureau! In this lesson plan, students analyze primary sources in the form of census data to do research that helps them answer questions about famous people and the time period during which they lived.
Lesson Plan
Researching the Past Using Primary Sources
Lesson Plan
Researching the Past Using Primary Sources
Knock, knock! It’s the U.S. Census Bureau! In this lesson plan, students analyze primary sources in the form of census data to do research that helps them answer questions about famous people and the time period during which they lived.
Fourth Grade
Reading
Lesson Plan
Moira's Birthday: Graphing
Lesson Plan
Moira's Birthday: Graphing
First Grade
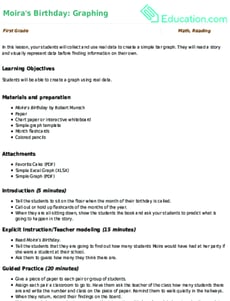
In this lesson, your students will collect and use real data to create a simple bar graph. They will read a story and visually represent data before finding information on their own.
Lesson Plan
Moira's Birthday: Graphing
Lesson Plan
Moira's Birthday: Graphing
In this lesson, your students will collect and use real data to create a simple bar graph. They will read a story and visually represent data before finding information on their own.
First Grade
Lesson Plan
Graphing a Fruit Survey
Lesson Plan
Graphing a Fruit Survey
First Grade
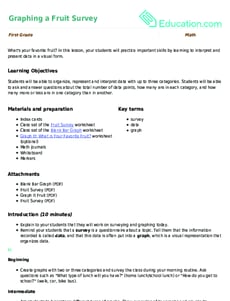
What's your favorite fruit? In this lesson, your students will practice important skills by learning to interpret and present data in a visual form.
Lesson Plan
Graphing a Fruit Survey
Lesson Plan
Graphing a Fruit Survey
What's your favorite fruit? In this lesson, your students will practice important skills by learning to interpret and present data in a visual form.
First Grade
Lesson Plan
Graph My Design
Lesson Plan
Graph My Design
First Grade
Geometry
Geometry meets data in this fun lesson! Students will build a design using pattern blocks and then graph the number of each shape used. This scaffolded EL lesson can be used alone or alongside
Graphing Colored Counters.
Lesson Plan
Graph My Design
Lesson Plan
Graph My Design
Geometry meets data in this fun lesson! Students will build a design using pattern blocks and then graph the number of each shape used. This scaffolded EL lesson can be used alone or alongside
Graphing Colored Counters.
First Grade
Geometry
Lesson Plan
Analyzing Primary Sources with Past Tense Verbs
Lesson Plan
Analyzing Primary Sources with Past Tense Verbs
Fourth Grade
Reading
Students will analyze census data from Sojourner Truth and Walt Disney using past tense verbs and sentence frames. It can be used on its own or as support to the lesson Researching the Past Using Primary Sources.
Lesson Plan
Analyzing Primary Sources with Past Tense Verbs
Lesson Plan
Analyzing Primary Sources with Past Tense Verbs
Students will analyze census data from Sojourner Truth and Walt Disney using past tense verbs and sentence frames. It can be used on its own or as support to the lesson Researching the Past Using Primary Sources.
Fourth Grade
Reading
Lesson Plan
Graphing Colored Counters
Lesson Plan
Graphing Colored Counters
Kindergarten
Data and Graphing
In this lesson, your students will use the background knowledge that they have about counting and sorting to graph data. They will practice answering questions about the graph!
Lesson Plan
Graphing Colored Counters
Lesson Plan
Graphing Colored Counters
In this lesson, your students will use the background knowledge that they have about counting and sorting to graph data. They will practice answering questions about the graph!
Kindergarten
Data and Graphing
Lesson Plan
Understanding Line Plots
Lesson Plan
Understanding Line Plots
Second Grade
Writing
This lesson provides students with the opportunity to critically think about data. Use this lesson alongside Line Plots: Representing the Length of Classroom Items or as a stand alone lesson.
Lesson Plan
Understanding Line Plots
Lesson Plan
Understanding Line Plots
This lesson provides students with the opportunity to critically think about data. Use this lesson alongside Line Plots: Representing the Length of Classroom Items or as a stand alone lesson.
Second Grade
Writing
Lesson Plan
What is it Telling Me? Creating and Interpreting Line Plots
Lesson Plan
What is it Telling Me? Creating and Interpreting Line Plots
Third Grade
Data and Graphing
Line plots are a great way to introduce your students to graphing data. In this lesson, your students will learn how to create a line plot and also practice interpreting line plots.
Lesson Plan
What is it Telling Me? Creating and Interpreting Line Plots
Lesson Plan
What is it Telling Me? Creating and Interpreting Line Plots
Line plots are a great way to introduce your students to graphing data. In this lesson, your students will learn how to create a line plot and also practice interpreting line plots.
Third Grade
Data and Graphing
Lesson Plan
Using Tape Models to Compare Like Fractions
Lesson Plan
Using Tape Models to Compare Like Fractions
Third Grade
Teach your students to compare fractions using symbols ( >, < = ) in three easy steps. Using this lesson plan, your class will compare like fractions using tape diagrams.
Lesson Plan
Using Tape Models to Compare Like Fractions
Lesson Plan
Using Tape Models to Compare Like Fractions
Teach your students to compare fractions using symbols ( >, < = ) in three easy steps. Using this lesson plan, your class will compare like fractions using tape diagrams.
Third Grade
Lesson Plan
Introduction to Charts and Diagrams
Lesson Plan
Introduction to Charts and Diagrams
Fourth Grade
Reading
Charts, graphs, and diagrams are complex text features for students to decipher. Use this lesson to familiarize students with these features. It can be taught on its own or before the lesson Charts and Graphs and Diagrams, Oh My!
Lesson Plan
Introduction to Charts and Diagrams
Lesson Plan
Introduction to Charts and Diagrams
Charts, graphs, and diagrams are complex text features for students to decipher. Use this lesson to familiarize students with these features. It can be taught on its own or before the lesson Charts and Graphs and Diagrams, Oh My!
Fourth Grade
Reading
Lesson Plan
1
2
3
4
…
43