SKIP TO CONTENT
Worksheet Generator
Subjects
Grades
Worksheets
Games
Build a Worksheet
More Resources
Roly Recommends
Subjects
Grades
Worksheets
Games
Build a Worksheet
More Resources
Roly Recommends
Showing Results for students : Page 4
Filters
Math
Data and Graphing
203 results
Search for: students
✕
Math
✕
Clear all
203 results
Subtopics:
Collecting and Organizing Data
Picture Graphs
Bar Graphs
Line Plots
Coordinate Plane
Box Plots
Histograms
Scatter Plots
Show Less
Filters
Search for: students
✕
Math
✕
Subjects
Math
English Language Arts
Science
Social Studies
Foreign Language
Technology
Grade Level
Pre-K
K
1st
2nd
3rd
4th
5th
6th
7th
8th
Early Childhood
Elementary School
Middle School
Resource Type
Worksheets
Games
Lesson Plans
Interactive Worksheets
Activities
Exercises
Offline Games
Guided Lessons
Teacher Resources
Occasion
Birthdays
Summer
Back to School
Halloween
Holidays
Valentine's Day
Common Core
Yes
Game Type
Ball Games
Printable Board Games
English Language Support
Yes
Clear all
View 203 results
Showing Results for students : Page 4
Filters
203 results
Search for: students
✕
Math
✕
Clear all
203 results
Pool Toys Pie Chart
Worksheet
Pool Toys Pie Chart
Second Grade
Data and Graphing
Sue found out people's favorite pool toys and posted her results in a pie chart. Students practice their analytical skills by coming up their own questions.
Worksheet
Pool Toys Pie Chart
Worksheet
Pool Toys Pie Chart
Sue found out people's favorite pool toys and posted her results in a pie chart. Students practice their analytical skills by coming up their own questions.
Second Grade
Data and Graphing
Worksheet
What Do We Know About Pets?
Worksheet
What Do We Know About Pets?
First Grade
Data and Graphing
Ms. Martin collected data about her class' favorite pets. Ask your students to use the bar graph with Ms. Martin's findings to answer the questions on the worksheet.
Worksheet
What Do We Know About Pets?
Worksheet
What Do We Know About Pets?
Ms. Martin collected data about her class' favorite pets. Ask your students to use the bar graph with Ms. Martin's findings to answer the questions on the worksheet.
First Grade
Data and Graphing
Worksheet
Create a Picture Graph (with your own data)
Worksheet
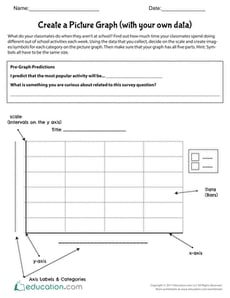
Create a Picture Graph (with your own data)
Fifth Grade
Data and Graphing
Using data that your students will generate in their class, they will create a picture graph that reflects how much time they spend doing different activities each week.
Worksheet
Create a Picture Graph (with your own data)
Worksheet
Create a Picture Graph (with your own data)
Using data that your students will generate in their class, they will create a picture graph that reflects how much time they spend doing different activities each week.
Fifth Grade
Data and Graphing
Worksheet
Picnic Bar Graph
Worksheet
Picnic Bar Graph
Second Grade
Data and Graphing
Which picnic games do you prefer? This bar graph shows some of the most popular picnic activities. Students will learn about analyzing data from a bar graph.
Worksheet
Picnic Bar Graph
Worksheet
Picnic Bar Graph
Which picnic games do you prefer? This bar graph shows some of the most popular picnic activities. Students will learn about analyzing data from a bar graph.
Second Grade
Data and Graphing
Worksheet
Create a Line Plot with Data Provided
Worksheet
Create a Line Plot with Data Provided
Third Grade
Data and Graphing
Use the data provided to have your students create a line plot that reflects how much TV watched per week for one third grade class.
Worksheet
Create a Line Plot with Data Provided
Worksheet
Create a Line Plot with Data Provided
Use the data provided to have your students create a line plot that reflects how much TV watched per week for one third grade class.
Third Grade
Data and Graphing
Worksheet
Mystery Picture Graph: Big City
Worksheet
Mystery Picture Graph: Big City
Fifth Grade
Geometry
Have a little fun with graphing practice in the big city! Math students will love plotting points on this coordinate grid as they see a mystery picture emerge.
Worksheet
Mystery Picture Graph: Big City
Worksheet
Mystery Picture Graph: Big City
Have a little fun with graphing practice in the big city! Math students will love plotting points on this coordinate grid as they see a mystery picture emerge.
Fifth Grade
Geometry
Worksheet
Measurement and Data 4
Guided Lesson
Measurement and Data 4
Fourth Grade
Fractions
Representing data on graphs makes math visual and involves some creativity and design. Plotting data using fractional units takes their learning one step further. Also in this unit, students learn to measure using both traditional units (like inches, feet and yards) and metric units, and how to convert measurements within each system. The concept of measurement gets two dimensional when students explore measuring and working with angles.
Guided Lesson
Measurement and Data 4
Guided Lesson
Measurement and Data 4
Representing data on graphs makes math visual and involves some creativity and design. Plotting data using fractional units takes their learning one step further. Also in this unit, students learn to measure using both traditional units (like inches, feet and yards) and metric units, and how to convert measurements within each system. The concept of measurement gets two dimensional when students explore measuring and working with angles.
Fourth Grade
Fractions
Guided Lesson
Be A Hot Air Balloon Designer!
Worksheet
Be A Hot Air Balloon Designer!
Kindergarten
Data and Graphing
Get your kindergartners' artistic juices flowing with this design your own hot air balloon worksheet. Students will enjoy the freedom of choosing their own colors and shapes.
Worksheet
Be A Hot Air Balloon Designer!
Worksheet
Be A Hot Air Balloon Designer!
Get your kindergartners' artistic juices flowing with this design your own hot air balloon worksheet. Students will enjoy the freedom of choosing their own colors and shapes.
Kindergarten
Data and Graphing
Worksheet
Mighty Mean, Median, and Mode
Lesson Plan
Mighty Mean, Median, and Mode
Fourth Grade
Data and Graphing
Give your students a good basis in interpreting data with this lesson that teaches them about mean, median, and mode with plenty of practice and cute videos to keep them interested.
Lesson Plan
Mighty Mean, Median, and Mode
Lesson Plan
Mighty Mean, Median, and Mode
Give your students a good basis in interpreting data with this lesson that teaches them about mean, median, and mode with plenty of practice and cute videos to keep them interested.
Fourth Grade
Data and Graphing
Lesson Plan
Be a Cake Designer!
Worksheet
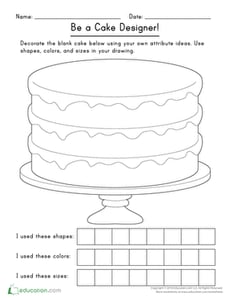
Be a Cake Designer!
Kindergarten
Data and Graphing
This fun worksheet will have your students decorating their very own delicious cake! Use different shapes, sizes, and color to make it as unique as you are.
Worksheet
Be a Cake Designer!
Worksheet
Be a Cake Designer!
This fun worksheet will have your students decorating their very own delicious cake! Use different shapes, sizes, and color to make it as unique as you are.
Kindergarten
Data and Graphing
Worksheet
Attribute Picture Hunt
Worksheet
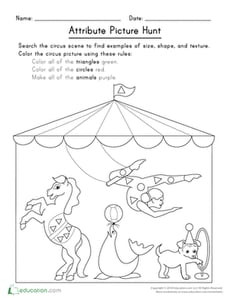
Attribute Picture Hunt
Kindergarten
Data and Graphing
This fun circus-themed coloring worksheet will have your students happily searching for different shapes and animals. They will be on the hunt for triangles, circles, and more!
Worksheet
Attribute Picture Hunt
Worksheet
Attribute Picture Hunt
This fun circus-themed coloring worksheet will have your students happily searching for different shapes and animals. They will be on the hunt for triangles, circles, and more!
Kindergarten
Data and Graphing
Worksheet
EL
Graph My Design
Lesson Plan
Graph My Design
First Grade
Geometry
Geometry meets data in this fun lesson! Students will build a design using pattern blocks and then graph the number of each shape used. This scaffolded EL lesson can be used alone or alongside
Graphing Colored Counters.
Lesson Plan
EL
Graph My Design
Lesson Plan
Graph My Design
Geometry meets data in this fun lesson! Students will build a design using pattern blocks and then graph the number of each shape used. This scaffolded EL lesson can be used alone or alongside
Graphing Colored Counters.
First Grade
Geometry
Lesson Plan
Rough or Smooth, Hard or Soft… How Does It Feel?
Worksheet
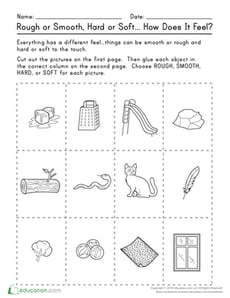
Rough or Smooth, Hard or Soft… How Does It Feel?
Kindergarten
Data and Graphing
Objects have different textures and feel. Is it soft like a cat's fur? Is it rough like sandpaper? Is it smooth like a slide? This worksheet wlill have your students identifying objects by the way they feel.
Worksheet
Rough or Smooth, Hard or Soft… How Does It Feel?
Worksheet
Rough or Smooth, Hard or Soft… How Does It Feel?
Objects have different textures and feel. Is it soft like a cat's fur? Is it rough like sandpaper? Is it smooth like a slide? This worksheet wlill have your students identifying objects by the way they feel.
Kindergarten
Data and Graphing
Worksheet
Flashcard Sorting!
Worksheet
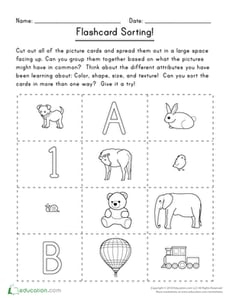
Flashcard Sorting!
Kindergarten
Data and Graphing
Your students will create their own set of flashcards by coloring the pictures and cutting them out. They will love using these to test their knowledge of categorizing items in as many ways as they can find possible!
Worksheet
Flashcard Sorting!
Worksheet
Flashcard Sorting!
Your students will create their own set of flashcards by coloring the pictures and cutting them out. They will love using these to test their knowledge of categorizing items in as many ways as they can find possible!
Kindergarten
Data and Graphing
Worksheet
Math + Love = Valentine's Day Bar Graph
Lesson Plan
Math + Love = Valentine's Day Bar Graph
Second Grade
Data and Graphing
What's more romantic than a bar graph on Valentine's Day? In this Valentine's Day lesson plan, students will use information from a data set to create their own tally charts and bar graphs and then analyze these graphs to answer questions.
Lesson Plan
Math + Love = Valentine's Day Bar Graph
Lesson Plan
Math + Love = Valentine's Day Bar Graph
What's more romantic than a bar graph on Valentine's Day? In this Valentine's Day lesson plan, students will use information from a data set to create their own tally charts and bar graphs and then analyze these graphs to answer questions.
Second Grade
Data and Graphing
Lesson Plan
Reading Graph
Worksheet
Reading Graph
Second Grade
Data and Graphing
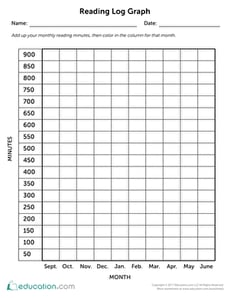
Maintaining a reading log is a fun way to encourage your child to set goals and track their progress. Students will keep track of their month-by-month reading stamina and practice their bar graphing with this reading log worksheet.
Worksheet
Reading Graph
Worksheet
Reading Graph
Maintaining a reading log is a fun way to encourage your child to set goals and track their progress. Students will keep track of their month-by-month reading stamina and practice their bar graphing with this reading log worksheet.
Second Grade
Data and Graphing
Worksheet
Bar Graphs: Favorite Fruit
Worksheet
Bar Graphs: Favorite Fruit
Second Grade
Data and Graphing
Bar graphing buffs, here is a fun worksheet for you and your students! Give them some practice making a bar graph from the data provided.
Worksheet
Bar Graphs: Favorite Fruit
Worksheet
Bar Graphs: Favorite Fruit
Bar graphing buffs, here is a fun worksheet for you and your students! Give them some practice making a bar graph from the data provided.
Second Grade
Data and Graphing
Worksheet
Measurement and Data 2
Guided Lesson
Measurement and Data 2
First Grade
Measurement
Measurement and data in first grade includes such important concepts as comparing the length and weight of two objects using a third object. This guided lesson, designed by curriculum experts, takes students on an exploration of these measurement and data concepts. Once through with the lesson, kids can gain extra practice with measurement and data with the accompanying worksheets.
Guided Lesson
Measurement and Data 2
Guided Lesson
Measurement and Data 2
Measurement and data in first grade includes such important concepts as comparing the length and weight of two objects using a third object. This guided lesson, designed by curriculum experts, takes students on an exploration of these measurement and data concepts. Once through with the lesson, kids can gain extra practice with measurement and data with the accompanying worksheets.
First Grade
Measurement
Guided Lesson
Data 2
Guided Lesson
Data 2
Fifth Grade
Fractions
Understanding data and graphs is a critical skill that we use on a regular basis to read news articles, reports and other media to interpret information. In this unit, students investigate data collection, data organization and visual representation in different kinds of graphics (i.e. line plots, pie charts). Learners also apply concepts of probability and statistics to analyze data.
Guided Lesson
Data 2
Guided Lesson
Data 2
Understanding data and graphs is a critical skill that we use on a regular basis to read news articles, reports and other media to interpret information. In this unit, students investigate data collection, data organization and visual representation in different kinds of graphics (i.e. line plots, pie charts). Learners also apply concepts of probability and statistics to analyze data.
Fifth Grade
Fractions
Guided Lesson
Let's Graph Our Fall Favorites!
Lesson Plan
Let's Graph Our Fall Favorites!
Second Grade
Data and Graphing
This engaging math lesson combines all of your kid's fall favorites as they learn to represent data using a bar graph.
Lesson Plan
Let's Graph Our Fall Favorites!
Lesson Plan
Let's Graph Our Fall Favorites!
This engaging math lesson combines all of your kid's fall favorites as they learn to represent data using a bar graph.
Second Grade
Data and Graphing
Lesson Plan
Interpreting Histograms
Worksheet
Interpreting Histograms
Sixth Grade
Data and Graphing
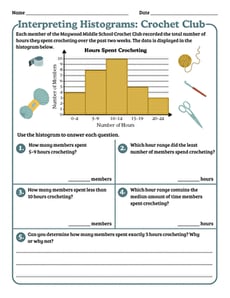
Get “hooked” on decoding data with this fun histogram worksheet!
Worksheet
Interpreting Histograms
Worksheet
Interpreting Histograms
Get “hooked” on decoding data with this fun histogram worksheet!
Sixth Grade
Data and Graphing
Worksheet
Whack-a-Duck
Game
Whack-a-Duck
Pre-K
Data and Graphing
Game
Whack-a-Duck
Game
Whack-a-Duck
Pre-K
Data and Graphing
Game
Graph Proportional Relationships #1
Worksheet
Graph Proportional Relationships #1
Eighth Grade
Ratios and Proportions
Help learners connect the constant of proportionality with the slope of a line in this one-page graphing worksheet!
Worksheet
Graph Proportional Relationships #1
Worksheet
Graph Proportional Relationships #1
Help learners connect the constant of proportionality with the slope of a line in this one-page graphing worksheet!
Eighth Grade
Ratios and Proportions
Worksheet
EL
Nature Counting
Lesson Plan
Nature Counting
Kindergarten
Data and Graphing
Use this fun lesson plan to introduce or review the concept of addition to your ELs. Can be used as a stand alone or support lesson for the
Nature and Counting It All Adds Up
lesson plan.
Lesson Plan
EL
Nature Counting
Lesson Plan
Nature Counting
Use this fun lesson plan to introduce or review the concept of addition to your ELs. Can be used as a stand alone or support lesson for the
Nature and Counting It All Adds Up
lesson plan.
Kindergarten
Data and Graphing
Lesson Plan
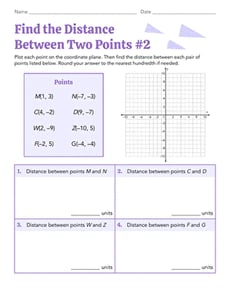
Find the Distance Between Two Points #2
Worksheet
Find the Distance Between Two Points #2
Eighth Grade
Geometry
Test your geometry skills and use the Pythagorean theorem in this eighth-grade worksheet!
Worksheet
Find the Distance Between Two Points #2
Worksheet
Find the Distance Between Two Points #2
Test your geometry skills and use the Pythagorean theorem in this eighth-grade worksheet!
Eighth Grade
Geometry
Worksheet
Find the Distance Between Two Points #1
Worksheet
Find the Distance Between Two Points #1
Eighth Grade
Geometry
Practice the Pythagorean theorem with this eighth-grade geometry worksheet!
Worksheet
Find the Distance Between Two Points #1
Worksheet
Find the Distance Between Two Points #1
Practice the Pythagorean theorem with this eighth-grade geometry worksheet!
Eighth Grade
Geometry
Worksheet
Creating Histograms From Frequency Tables
Worksheet
Creating Histograms From Frequency Tables
Sixth Grade
Data and Graphing
Practice using histograms to show different sets of data in this engaging sixth-grade worksheet!
Worksheet
Creating Histograms From Frequency Tables
Worksheet
Creating Histograms From Frequency Tables
Practice using histograms to show different sets of data in this engaging sixth-grade worksheet!
Sixth Grade
Data and Graphing
Worksheet
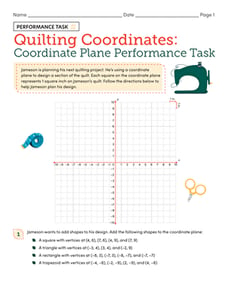
Quilting Coordinates: Coordinate Plane Performance Task
Worksheet
Quilting Coordinates: Coordinate Plane Performance Task
Sixth Grade
Geometry
Help Jameson plan his design for a quilting project in this coordinate plane performance task!
Worksheet
Quilting Coordinates: Coordinate Plane Performance Task
Worksheet
Quilting Coordinates: Coordinate Plane Performance Task
Help Jameson plan his design for a quilting project in this coordinate plane performance task!
Sixth Grade
Geometry
Worksheet
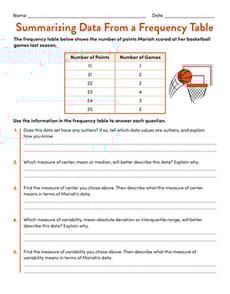
Summarizing Data From a Frequency Table
Worksheet
Summarizing Data From a Frequency Table
Sixth Grade
Data and Graphing
Practice summarizing a numerical data set with this one-page statistics worksheet!
Worksheet
Summarizing Data From a Frequency Table
Worksheet
Summarizing Data From a Frequency Table
Practice summarizing a numerical data set with this one-page statistics worksheet!
Sixth Grade
Data and Graphing
Worksheet
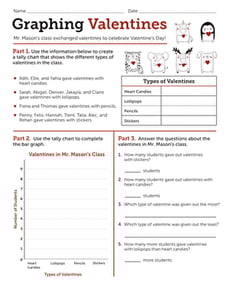
Graphing Valentines
Worksheet
Graphing Valentines
Second Grade
Data and Graphing
In this Valentine's Day math worksheet, learners will tally, graph, and interpret data about a classroom gift exchange.
Worksheet
Graphing Valentines
Worksheet
Graphing Valentines
In this Valentine's Day math worksheet, learners will tally, graph, and interpret data about a classroom gift exchange.
Second Grade
Data and Graphing
Worksheet
1
2
3
4
5
6
7